. 2022 Jul 30;23(15):8450.
doi: 10.3390/ijms23158450.

Unravelling the Inflammatory Processes in the Early Stages of Diabetic Nephropathy and the Potential Effect of (Ss)-DS-ONJ

Affiliations

Unravelling the Inflammatory Processes in the Early Stages of Diabetic Nephropathy and the Potential Effect of (Ss)-DS-ONJ

Laura Gómez-Jaramillo et al. Int J Mol Sci. .

Abstract

Inflammatory processes play a central role in the pathogenesis of diabetic nephropathy (DN) in the early stages of the disease. The authors demonstrate that the glycolipid mimetic (Ss)-DS-ONJ is able to abolish inflammation via the induction of autophagy flux and provokes the inhibition of inflammasome complex in ex vivo and in vitro models, using adult kidney explants from BB rats. The contribution of (Ss)-DS-ONJ to reducing inflammatory events is mediated by the inhibition of classical stress kinase pathways and the blocking of inflammasome complex activation. The (Ss)-DS-ONJ treatment is able to inhibit the epithelial-to-mesenchymal transition (EMT) progression, but only when the IL18 levels are reduced by the treatment. These findings suggest that (Ss)-DS-ONJ could be a novel, and multifactorial treatment for DN.

Keywords: (Ss)-DS-ONJ; autophagy; diabetic nephropathy; epithelial mesenchymal transition; inflammation.


Conflict of interest statement

The authors declare no conflict of interest.

Figures
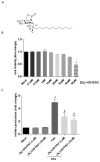
Figure 1
Figure 1
Anti-inflammatory effects of (SS)-DS-ONJ in CKs-stimulated MCT cells. (A) Chemical structure of (SS)-DS-ONJ. (B) MCT cells were treated for 24 h with (SS)-DS-ONJ (0.1–50 µM). Viability was determined by crystal violet staining. Colorimetric quantification was performed and the results are shown as mean ± SEM (n = 3 independent experiments). (C) MCT cells were treated for 24 h with CKs or CKs plus (SS)-DS-ONJ (1–10 μM). Nitrite accumulation was analyzed and related to the basal levels. Colorimetric quantification was performed, and the results are expressed as mean ± SEM (n = 6 independent experiments). The fold change relative to the basal condition is shown; * p ≤ 0.05 vs. Basal; # p ≤ 0.05 vs. CKs (two-way ANOVA followed by Bonferroni t-test).
Figure 2
Figure 2
Resolution of inflammation in CKs-stimulated MCT cells by induction of autophagy flux in the presence of (SS)-DS-ONJ. (A) Protein extracts were analyzed by Western blot with the corresponding antibodies against iNOS and α-tubulin as a loading control. (n = 6 independent experiments). mRNA levels of Nos2 were determined by qRT-PCR. The results are expressed as means ± SEM. (n = 6 independent experiments performed in triplicate). (B) mRNA levels of Tnfa and Il1b were determined by qRT-PCR. (n = 3 independent experiments performed in triplicate). (C) Protein extracts were analyzed by Western blot with antibodies against caspase-1 and α-tubulin as a loading control. (n = 6 independent experiments). (D) Nlrp3 mRNA levels. Actinb as a housekeeping control was determined by qRT-PCR (n = 3 independent experiments performed in triplicate). (E,F) Protein extracts were analyzed by Western blot with antibodies against LC3II/I, p62 and α-tubulin as loading control for p62. (n = 4 independent experiments). The fold change relative to the basal condition is shown; * p ≤ 0.05 vs. Basal condition; # p ≤ 0.05 vs. CKs stimuli; + p ≤ 0.05 vs. CLQ stimuli (two-way ANOVA followed by Bonferroni t-test).
Figure 2
Figure 2
Resolution of inflammation in CKs-stimulated MCT cells by induction of autophagy flux in the presence of (SS)-DS-ONJ. (A) Protein extracts were analyzed by Western blot with the corresponding antibodies against iNOS and α-tubulin as a loading control. (n = 6 independent experiments). mRNA levels of Nos2 were determined by qRT-PCR. The results are expressed as means ± SEM. (n = 6 independent experiments performed in triplicate). (B) mRNA levels of Tnfa and Il1b were determined by qRT-PCR. (n = 3 independent experiments performed in triplicate). (C) Protein extracts were analyzed by Western blot with antibodies against caspase-1 and α-tubulin as a loading control. (n = 6 independent experiments). (D) Nlrp3 mRNA levels. Actinb as a housekeeping control was determined by qRT-PCR (n = 3 independent experiments performed in triplicate). (E,F) Protein extracts were analyzed by Western blot with antibodies against LC3II/I, p62 and α-tubulin as loading control for p62. (n = 4 independent experiments). The fold change relative to the basal condition is shown; * p ≤ 0.05 vs. Basal condition; # p ≤ 0.05 vs. CKs stimuli; + p ≤ 0.05 vs. CLQ stimuli (two-way ANOVA followed by Bonferroni t-test).
Figure 3
Figure 3
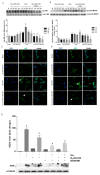
Effects of (SS)-DS-ONJ on stress kinase pathways in CKs-stimulated MCT cells. (A,B) Protein extracts were separated by SDS-PAGE and analyzed by Western blot with antibodies against phosphorylated (p)-JNK, total JNK, phosphorylated (p)-p38α MAPK and total p38α MAPK. Representative images are shown (n = 6 independent experiments). (C,D) Confocal immunofluorescence assessment of the nuclear translocation of p65-NFκB in MCT cells following stimulation with CKs in the absence or presence of (SS)-DS-ONJ. The activation of p65-NFκB nuclear translocation was defined as an increase in the immunofluorescence of p65-NFκB (green channel) in the nuclear regions. The nuclear regions of MCT cells were visualized by counterstaining of nuclear DNA with DAPI (blue channel). The nuclear localization of p65-NFκB was detected in MCT cells upon stimulation with CKs at 30 min and 90 min, but not in MCT cells pre-treated with 10 μM (SS)-DS-ONJ (white arrows). (E) Protein extracts were separated by SDS-PAGE and analyzed by Western blot with antibodies against iNOS and α-tubulin as a loading control. The fold change relative to the basal condition is shown; * p ≤ 0.05 vs. Basal condition; # p ≤ 0.05 vs. CKs stimuli (two-way ANOVA followed by Bonferroni t-test).
Figure 4
Figure 4
EMT progression is inhibited by (SS)-DS-ONJ in CKs-stimulated MCT cells. (A) Protein extracts were analyzed by Western blot with antibodies against E-cadherin, α- SMA and α-tubulin as a loading control. (n = 4 independent experiments). (B,C) Cadherin-1, Acta-2, Tgfb and Il18 mRNA levels were determined by qRT-PCR. (n = 4 independent experiments performed in triplicate). (D) Il18, Tgfb, Cadherin-1 and Acta-2 mRNA levels were determined by qRT-PCR after siRNA Il18 treatment and Actinb was used as housekeeping control (n = 4 independent experiments performed in triplicate). (E) Protein extracts were analyzed by Western blot with antibodies against ZEB-1, Snail, Slug and α-tubulin as a loading control. The fold change relative to the basal condition is shown; * p ≤ 0.05 vs. Basal condition; # p ≤ 0.05 vs. CKs stimuli (two-way ANOVA followed by Bonferroni t-test).
Figure 4
Figure 4
EMT progression is inhibited by (SS)-DS-ONJ in CKs-stimulated MCT cells. (A) Protein extracts were analyzed by Western blot with antibodies against E-cadherin, α- SMA and α-tubulin as a loading control. (n = 4 independent experiments). (B,C) Cadherin-1, Acta-2, Tgfb and Il18 mRNA levels were determined by qRT-PCR. (n = 4 independent experiments performed in triplicate). (D) Il18, Tgfb, Cadherin-1 and Acta-2 mRNA levels were determined by qRT-PCR after siRNA Il18 treatment and Actinb was used as housekeeping control (n = 4 independent experiments performed in triplicate). (E) Protein extracts were analyzed by Western blot with antibodies against ZEB-1, Snail, Slug and α-tubulin as a loading control. The fold change relative to the basal condition is shown; * p ≤ 0.05 vs. Basal condition; # p ≤ 0.05 vs. CKs stimuli (two-way ANOVA followed by Bonferroni t-test).
Figure 5
Figure 5
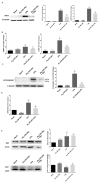
(SS)-DS-ONJ inhibits the inflammatory events in CKs-stimulated AK explants from WT rats. (A) Protein extracts were analyzed by Western blot with the corresponding antibodies against iNOS and α-tubulin as a loading control (n = 6 AK explants per condition). mRNA levels of Nos2 were determined by qRT-PCR (n = 6 AK explants per condition). (B) mRNA levels of Tnfa, Il1b and Nlrp3 were determined by qRT-PCR and Actinb was used as housekeeping control (n = 6 AK explants per condition). (C) Protein extracts were analyzed by Western blot with antibodies against LC3II/I, p62 and α-tubulin as loading control of p62 (n = 6 AK explants per condition). The fold change relative to the basal condition is shown; * p ≤ 0.05 vs. Basal condition; # p ≤ 0.05 vs. CKs stimuli (two-way ANOVA followed by Bonferroni t-test).
Figure 6
Figure 6
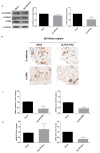
(SS)-DS-ONJ reverts the EMT induced in CKs-stimulated AK explants from WT rats. (A) Protein extracts were analyzed by Western blot with antibodies against E-cadherin, α-SMA and α-tubulin as loading control (n = 6 AK explants per condition). (B) Immunohistochemical analyses of E-cadherin (upper panel) and α-SMA (bottom panel). Original magnification: 20×. Scale bar = 0.5 mm; n = 4 AK explants per condition. Three individual slides from six different animals were analyzed. (C) Tgfb, Cadherin-1 and Acta-2 mRNA levels were determined by qRT-PCR and Actinb was used as housekeeping control (n = 6 AK explants per condition). (D) Il18 mRNA levels were determined by qRT-PCR and Actinb was used as housekeeping control (n = 6 AK explants per condition). The fold change relative to the basal condition is shown; * p ≤ 0.05 vs. Basal condition; # p ≤ 0.05 vs. CKs stimuli (two-way ANOVA followed by Bonferroni t-test).
Figure 7
Figure 7
(SS)-DS-ONJ ameliorates inflammatory parameters in AK explants from pre-diabetic BB rats. (A) Analysis of iNOS in AK explants from BB rats during DN progression. Protein levels were analyzed in AK explants by Western blot. α-tubulin was used as a loading control (n = 6 AK explants per condition). mRNA levels of Nos2 were determined by qRT-PCR and Actinb was used as housekeeping control (n = 6 AK explants per condition). (B) mRNA levels of Tnfa, Il1b and Nlrp3 were determined by qRT-PCR and Actinb was used as housekeeping control (n = 6 AK explants per condition). (C) Protein extracts were analyzed by Western blot with antibodies against LC3II/I, p62 and α-tubulin as loading control of p62 (n = 6 AK explants per condition). The fold change relative to the basal condition is shown; * p ≤ 0.05 vs. Basal condition (Mann-Whitney test).
Figure 8
Figure 8
The EMT status in AK explants from pre-diabetic BB rats is not reverted by (SS)-DS-ONJ. (A) Protein extracts were analyzed by Western blot with antibodies against E-cadherin, α-SMA and α-tubulin as a loading control (n = 6 AK explants per condition). (B) Immunohistochemical analyses of E-cadherin (upper panel) and α-SMA (bottom panel). Original magnification: 20×. Scale bar = 0.5 mm; n = 4 AK explants per condition. Three individual slides from six different animals were analyzed. (C) Tgfb, Cadherin-1 and Acta-2 mRNA levels were determined by qRT-PCR and Actinb was used as housekeeping control. (D) Il18 mRNA levels were determined by qRT-PCR and Actinb was used as housekeeping control (n = 6 AK explants per condition). Three individual slides from six different animals were analyzed. (E) Protein extracts were analyzed by Western blot with antibodies against ZEB-1, snail and α-tubulin as a loading control. (n = 6 AK explants per condition). The fold change relative to the basal condition is shown; * p ≤ 0.05 vs. Basal condition (Mann–Whitney test).
Figure 8
Figure 8
The EMT status in AK explants from pre-diabetic BB rats is not reverted by (SS)-DS-ONJ. (A) Protein extracts were analyzed by Western blot with antibodies against E-cadherin, α-SMA and α-tubulin as a loading control (n = 6 AK explants per condition). (B) Immunohistochemical analyses of E-cadherin (upper panel) and α-SMA (bottom panel). Original magnification: 20×. Scale bar = 0.5 mm; n = 4 AK explants per condition. Three individual slides from six different animals were analyzed. (C) Tgfb, Cadherin-1 and Acta-2 mRNA levels were determined by qRT-PCR and Actinb was used as housekeeping control. (D) Il18 mRNA levels were determined by qRT-PCR and Actinb was used as housekeeping control (n = 6 AK explants per condition). Three individual slides from six different animals were analyzed. (E) Protein extracts were analyzed by Western blot with antibodies against ZEB-1, snail and α-tubulin as a loading control. (n = 6 AK explants per condition). The fold change relative to the basal condition is shown; * p ≤ 0.05 vs. Basal condition (Mann–Whitney test).

Similar articles

Cited by

References

    1. Pickup J.C. Inflammation and Activated Innate Immunity in the Pathogenesis of Type 2 Diabletes. Diabetes Care. 2004;27:813–823. doi: 10.2337/diacare.27.3.813. - DOI - PubMed
    1. Tsalamandris S., Antonopoulos A.S., Oikonomou E., Papamikroulis G.A., Vogiatzi G., Papaioannou S., Deftereos S., Tousoulis D. The role of inflammation in diabetes: Current concepts and future perspectives. Eur. Cardiol. Rev. 2019;14:50–59. doi: 10.15420/ecr.2018.33.1. - DOI - PMC - PubMed
    1. Zheng Z., Zheng F. Immune Cells and Inflammation in Diabetic Nephropathy. J. Diabetes Res. 2016;2016:1841690. doi: 10.1155/2016/1841690. - DOI - PMC - PubMed
    1. Wada J., Makino H. Inflammation and the pathogenesis of diabetic nephropathy. Clin. Sci. 2013;124:139–152. doi: 10.1042/CS20120198. - DOI - PubMed
    1. Navarro J.F., Milena F.J., Mora C., León C., García J. Renal pro-inflammatory cytokine gene expression in diabetic nephropathy: Effect of angiotensin-converting enzyme inhibition and pentoxifylline administration. Am. J. Nephrol. 2007;26:562–570. doi: 10.1159/000098004. - DOI - PubMed