. 2022 Jul 30;23(15):8480.
doi: 10.3390/ijms23158480.

Involvement of Auxin-Mediated CqEXPA50 Contributes to Salt Tolerance in Quinoa (Chenopodium quinoa) by Interaction with Auxin Pathway Genes

Affiliations

Involvement of Auxin-Mediated CqEXPA50 Contributes to Salt Tolerance in Quinoa (Chenopodium quinoa) by Interaction with Auxin Pathway Genes

Wenjun Sun et al. Int J Mol Sci. .

Abstract

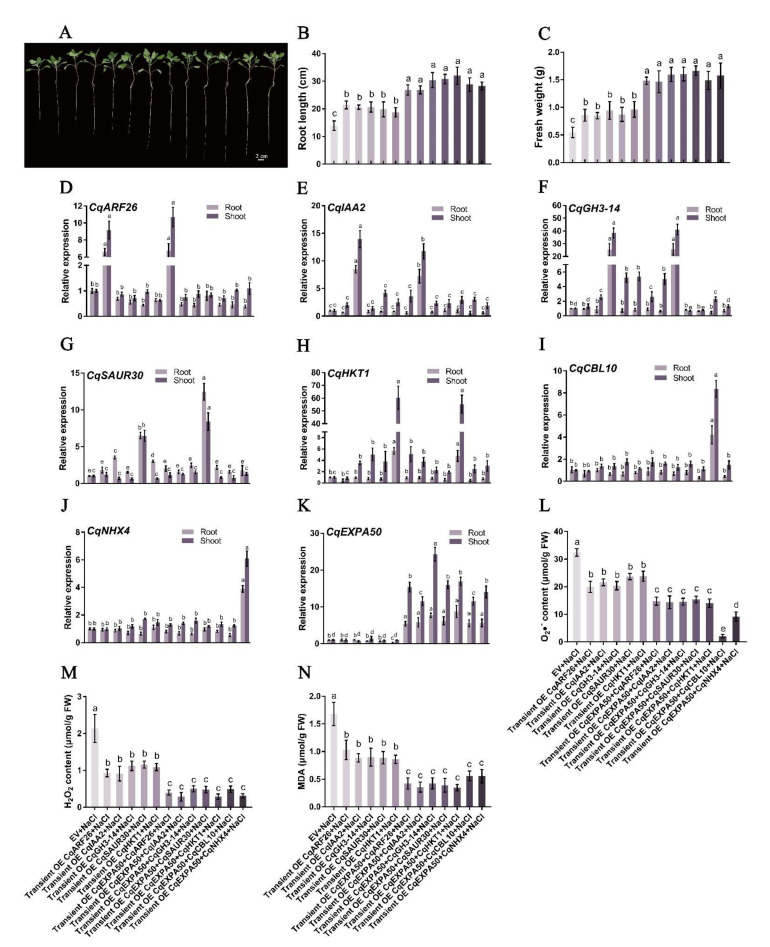
Soil salinization is a global problem that limits crop yields and threatens agricultural development. Auxin-induced expansins contribute to plant salt tolerance through cell wall loosening. However, how auxins and expansins contribute to the adaptation of the halophyte quinoa (Chenopodium quinoa) to salt stress has not yet been reported. Here, auxin was found to contribute to the salt tolerance of quinoa by promoting the accumulation of photosynthetic pigments under salt stress, maintaining enzymatic and nonenzymatic antioxidant systems and scavenging excess reactive oxygen species (ROS). The Chenopodium quinoa expansin (Cqexpansin) family and the auxin pathway gene family (Chenopodium quinoa auxin response factor (CqARF), Chenopodium quinoa auxin/indoleacetic acid (CqAux/IAA), Chenopodium quinoa Gretchen Hagen 3 (CqGH3) and Chenopodium quinoa small auxin upregulated RNA (CqSAUR)) were identified from the quinoa genome. Combined expression profiling identified Chenopodium quinoa α-expansin 50 (CqEXPA50) as being involved in auxin-mediated salt tolerance. CqEXPA50 enhanced salt tolerance in quinoa seedlings was revealed by transient overexpression and physiological and biochemical analyses. Furthermore, the auxin pathway and salt stress-related genes regulated by CqEXPA50 were identified. The interaction of CqEXPA50 with these proteins was demonstrated by bimolecular fluorescence complementation (BIFC). The proteins that interact with CqEXPA50 were also found to improve salt tolerance. In conclusion, this study identified some genes potentially involved in the salt tolerance regulatory network of quinoa, providing new insights into salt tolerance.

Keywords: Cqexpansin; antioxidant capacity; auxin; auxin pathway gene; salt stress.


Conflict of interest statement

The authors declare no conflict of interest.

Figures

Figure 1
Figure 1
Effect of IAA on the growth and antioxidant capacity of quinoa roots under salt stress. Quinoa seedlings of six true leaves were cultured in Hoagland solution (CK), 150 mM NaCl-Hoagland solution, 150 mM NaCl + 3 μM IAA-Hoagland solution and 150 mM NaCl + 3 μM IAA + 7 μM NPA-Hoagland solution for two weeks and then phenotype, root length and fresh weight were recorded. (A) Phenotypic changes in quinoa seedlings under different treatments. Bar = 2 cm; (B) The root length; (C) The fresh weight. (D) O2• content in roots; (E) H2O2 content in roots; (F) MDA content in roots. (G) POD activity in roots; (H) CAT activity in roots. (I) GSH content in roots; (J) ASA content in roots. Values are mean ± SD (n = 3). Different letters (a–d) in Figure 1B−J indicate significant differences at p < 0.05 according to one-way ANOVA (comparing the mean of each column with the mean of every other column) in GraphPad Prism 7.04.
Figure 2
Figure 2
Analysis and identification of Cqexpansin family in quinoa.
Figure 3
Figure 3
Effects of IAA and NPA on the expressions of Cqexpansin genes in quinoa root and shoot under salt stress. Quinoa seedlings of six true leaves were cultured in Hoagland solution (CK), 150 mM NaCl-Hoagland solution, 150 mM NaCl + 3 μM IAA-Hoagland solution and 150 mM NaCl + 3 μM IAA + 7 μM NPA-Hoagland solution for two weeks, and then qRT-PCR was used to detect the expression of different genes. Values are mean ± SD (n = 3). Different letters (a–d) in Figure 3 indicate significant differences at p < 0.05 according to one-way ANOVA (comparing the mean of each column with the mean of every other column) in GraphPad Prism 7.04.
Figure 4
Figure 4
Effects of CqEXPA50 on the growth and antioxidant capacity of quinoa roots under salt stress. The phenotype, root length and fresh weight of all these quinoa seedlings in different treatments were recorded. (A) Phenotypic changes in quinoa seedlings under different treatments. Bar = 2 cm. (B) The root length. (C) The fresh weight. (D) MDA staining results under different treatments. The redder the color, the greater the MDA content. Bar = 2 cm. (E) H2O2 staining results under different treatments. The browner the color, the greater the H2O2 content. Bar = 2 cm. (F) O2 staining results under different treatments. The bluer the color, the great the O2 content. Bar = 2 cm. (G) MDA content in roots. (H) H2O2 content in roots. (I) O2 content in roots. (J) SOD activity. (K) POD activity. (L) CAT activity. (M) APX activity. (N) GSH content. (O) ASA content. Values are the mean ± SD (n = 3). Different letters (a–d) in Figure 4 indicate significant differences at p < 0.05 according to one-way ANOVA (comparing the mean of each column with the mean of every other column) in GraphPad Prism 7.04.
Figure 5
Figure 5
Effects of CqEXPA50 on the expressions of auxin pathway genes in quinoa root and shoot under salt stress. The expression of auxin pathway genes of all these quinoa seedlings in different treatments were then determined. Values are the mean ± SD (n = 3). Different letters (a–d) in Figure 5 indicate significant differences at p < 0.05 according to one-way ANOVA (comparing the mean of each column with the mean of every other column) in GraphPad Prism 7.04.
Figure 6
Figure 6
Interactions between CqEXPA50 and CqARF26, CqIAA2, CqGH3-14 and CqSAUR30. CqEXPA50 interact with CqARF26, CqIAA2, CqGH3-14 and CqSAUR30 in N. benthamiana leaves. CqEXPA50 was fused with the N-terminal fragment (YN) of yellow fluorescence protein (YFP) to form CqEXPA50-YN. CqARF26, CqIAA2, CqGH3-14 and CqSAUR30 were fused with C-terminal fragment of YFP (YC) to form CqARF26-YC, CqIAA2-YC, CqGH3-14-YC and CqSAUR30-YC. Green indicates a positive interaction signal. No signal was observed from negative controls. Red represents the nuclear localization signal.
Figure 7
Figure 7
Interactions between CqEXPA50 andCqNHX4, CqCBL10 and CqHKT1. CqEXPA50 interact with CqNHX4, CqCBL10 and CqHKT1 in N. benthamiana leaves. CqEXPA50 was fused with the C-terminal fragment (YC) of yellow fluorescence protein (YFP) to form CqEXPA50-YC. CqNHX4, CqCBL10 and CqHKT1 were fused with N-terminal fragment of YFP (YN) to form CqNHX4-YN, CqCBL10-YN and CqHKT1-YN. Green indicates a positive interaction signal. No signal was observed from negative controls. Red represents the nuclear localization signal.
Figure 8
Figure 8
Effect of CqARF26, CqIAA2, CqGH3-14, CqSAUR30 and CqHKT1 on salt tolerance in quinoa seedling roots. Relevant indicators of all these quinoa seedling roots in different treatments were determined. (A) The effects of CqARF26, CqIAA2, CqGH3-14, CqSAUR30 and CqHKT1 on the phenotype of quinoa seedlings under salt stress. Bar = 2 cm. (B) The root length. (C) The fresh weight. (D) Expression analysis of CqARF26 in quinoa root and shoot under salt stress after transient overexpression of CqARF26. (E) Expression analysis of CqIAA2 in quinoa root and shoot under salt stress after transient overexpression of CqIAA2. (F) Expression analysis of CqGH3-14 in quinoa root and shoot under salt stress after transient overexpression of CqGH3-14. (G) Expression analysis of CqSAUR30 in quinoa root and shoot under salt stress after transient overexpression of CqSAUR30. (H) Expression analysis of CqHKT1 in quinoa root and shoot under salt stress after transient overexpression of CqHKT1. (I) The O2• content changes in quinoa roots under different treatments. (J) The H2O2 content changes in quinoa roots under different treatments. (K) The MDA content changes in quinoa roots under different treatments. Values are the mean ± SD (n = 3). Different letters (a–e) in Figure 8B−K indicate significant differences at p < 0.05 according to one-way ANOVA (comparing the mean of each column with the mean of every other column) in GraphPad Prism 7.04.
Figure 9
Figure 9
CqEXPA50 participates in salt tolerance of quinoa seedling roots together with CqARF26, CqIAA2, CqGH3-14, CqSAUR30, CqHKT1, CqCBL10 or CqNHX4. Relevant indicators of all these quinoa seedlings roots in different treatments were determined. (A) The effects of simultaneous transient overexpression on the phenotype of quinoa seedlings under salt stress. Bar = 2 cm. (B) The root length. (C) The fresh weight. (D) Expression analysis of CqARF26 in quinoa root and shoot under salt stress after transient overexpression. (E) Expression analysis of CqIAA2 in quinoa root and shoot under salt stress after transient overexpression. (F) Expression analysis of CqGH3-14 in quinoa roots under salt stress after transient overexpression. (G) Expression analysis of CqSAUR30 in quinoa roots under salt stress after transient overexpression. (H) Expression analysis of CqHKT1 in quinoa roots under salt stress after transient overexpression. (I) Expression analysis of CqCBL10 in quinoa roots under salt stress after transient overexpression. (J) Expression analysis of CqNHX4 in quinoa roots under salt stress after transient overexpression. (K) Expression analysis of CqEXPA50 in quinoa roots under salt stress after transient overexpression. (L) The O2• content changes in quinoa roots under different treatments. (M) The H2O2 content changes in quinoa roots under different treatments. (N) The MDA content changes in quinoa roots under different treatments. Values are the mean ± SD (n = 3). Different letters (a–e) in Figure 9B−N indicate significant differences at p < 0.05 according to one-way ANOVA (comparing the mean of each column with the mean of every other column) in GraphPad Prism 7.04.
Figure 10
Figure 10
A proposed model to illustrate how CqEXP50, CqARF26, CqIAA2, CqGH3-14, CqSAUR30 and CqHKT1 enhance salt tolerance of quinoa seedlings.

Similar articles

Cited by

References

    1. Yang Y.Q., Guo Y. Elucidating the molecular mechanisms mediating plant salt—Stress responses. New Phytol. 2017;217:523–539. doi: 10.1111/nph.14920. - DOI - PubMed
    1. Ruan C.J., Teixeira da Silva J.A., Mopper S., Qind P., Lutts S. Halophyte improvement for a salinized world. Crit. Rev. Plant Sci. 2010;29:329–359. doi: 10.1080/07352689.2010.524517. - DOI
    1. Dhankher O.P., Foyer C. Climate resilient crops for improving global food security and safety. Plant Cell Environ. 2018;41:877–884. doi: 10.1111/pce.13207. - DOI - PubMed
    1. Raza A., Razzaq A., Mehmood S., Zou X.L., Zhang X.K., Lv Y., Xu J.S. Impact of climate change on crops adaptation and strategies to tackle its outcome: A review. Plants. 2019;8:34–63. doi: 10.3390/plants8020034. - DOI - PMC - PubMed
    1. Zelm E.V., Zhang Y.X., Testerink C. Salt tolerance mechanisms of plants. Annu. Rev. Plant. Biol. 2020;71:1–31. - PubMed

MeSH terms

Substances

LinkOut - more resources