

Distinct Longitudinal Changes in Immunoglobulin G N-Glycosylation Associate with Therapy Response in Chronic Inflammatory Diseases
- PMID: 35955616
- PMCID: PMC9368836
- DOI: 10.3390/ijms23158473
Distinct Longitudinal Changes in Immunoglobulin G N-Glycosylation Associate with Therapy Response in Chronic Inflammatory Diseases
Abstract
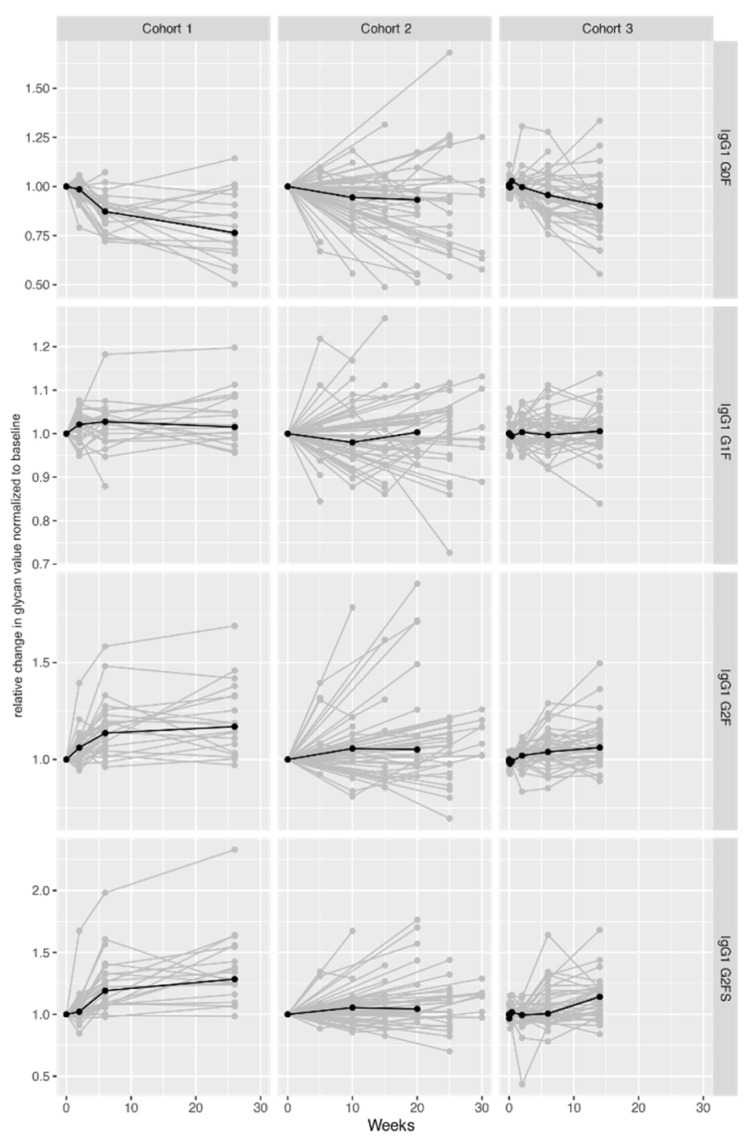
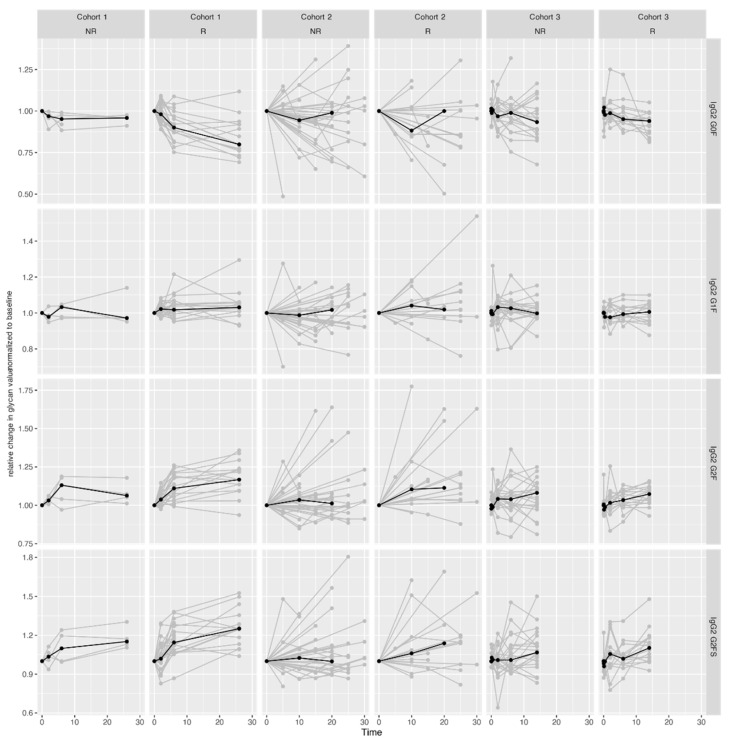
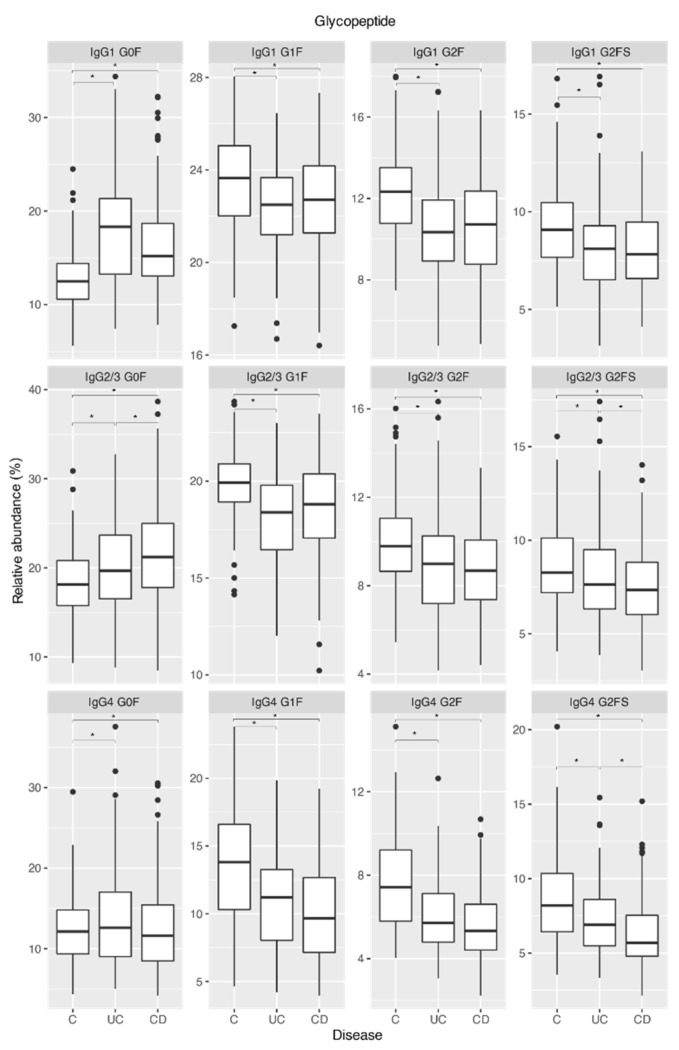
Immunosuppressants and biologicals are widely used therapeutics for various chronic inflammatory diseases (CID). To gain more detailed insight into their downstream effects, we examined their impact on serum immunoglobulin G (IgG) glycosylation. We analyzed IgG subclass-specific fragment crystallizable (Fc) N-glycosylation in patients suffering from various CID using the LC-MS approach. Firstly, we compared IgG Fc N-glycosylation between 128 CID patients and 204 healthy controls. Our results replicated previously observed CID-related decrease in IgG Fc galactosylation (adjusted p-value range 1.70 × 10⁻²-5.95 × 10⁻²²) and sialylation (adjusted p-value range 1.85 × 10⁻²-1.71 × 10⁻¹⁸). Secondly, to assess changes in IgG Fc N-glycosylation associated with therapy and remission status, we compared 139 CID patients receiving either azathioprine, infliximab, or vedolizumab therapy. We observed an increase in IgG Fc galactosylation (adjusted p-value range 1.98 × 10⁻²-1.30 × 10⁻¹⁵) and sialylation (adjusted p-value range 3.28 × 10⁻⁶-4.34 × 10⁻¹⁸) during the treatment. Furthermore, patients who reached remission displayed increased Fc galactosylation levels (p-value range 2.25 × 10⁻²-5.44 × 10⁻³) in comparison to patients with active disease. In conclusion, the alterations in IgG Fc glycosylation and the fact these changes are even more pronounced in patients who achieved remission, suggest modulation of IgG inflammatory potential associated with CID therapy.
Keywords: IgG glycosylation; autoimmune diseases; chronic inflammatory diseases; inflammatory bowel disease; personalized medicine; response.
Conflict of interest statement
G.L. is the founder and CEO of Genos Ltd., a private research organization specializing in high-throughput glycomic analysis, and has several patents in this field. J.Š., F.V., S.H., M.N. and M.P. are employees of Genos Ltd. G.L. is the founder and owner of Genos Glycoscience Ltd.—a spin-off of Genos Ltd. that commercializes its scientific discoveries. M.P. and F.V. are employees of Genos Glycoscience Ltd. G.L. is the founder and CSO of GlycanAge Ltd.—the company offering the first glycan-based test for biological age. The other authors declare no conflict of interest.
Figures
Similar articles
-
Baseline IgG-Fc N-glycosylation profile is associated with long-term outcome in a cohort of early inflammatory arthritis patients.Arthritis Res Ther. 2022 Aug 25;24(1):206. doi: 10.1186/s13075-022-02897-5. Arthritis Res Ther. 2022. PMID: 36008868 Free PMC article.
-
IgG-Fc glycosylation before and after rituximab treatment in immune thrombocytopenia.Sci Rep. 2020 Feb 20;10(1):3051. doi: 10.1038/s41598-020-59651-7. Sci Rep. 2020. PMID: 32080262 Free PMC article.
-
Glycomics for Type 2 Diabetes Biomarker Discovery: Promise of Immunoglobulin G Subclass-Specific Fragment Crystallizable N-glycosylation in the Uyghur Population.OMICS. 2019 Dec;23(12):640-648. doi: 10.1089/omi.2019.0052. Epub 2019 Aug 8. OMICS. 2019. PMID: 31393219
-
IgG Fc N-glycosylation: Alterations in neurologic diseases and potential therapeutic target?J Autoimmun. 2019 Jan;96:14-23. doi: 10.1016/j.jaut.2018.10.006. Epub 2018 Oct 22. J Autoimmun. 2019. PMID: 30360925 Review.
-
IgG N-glycans.Adv Clin Chem. 2021;105:1-47. doi: 10.1016/bs.acc.2021.02.001. Epub 2021 Mar 18. Adv Clin Chem. 2021. PMID: 34809825 Review.
Cited by
-
Association between immunoglobulin G N-glycosylation and lupus nephritis in female patients with systemic lupus erythematosus: a case-control study.Front Immunol. 2023 Sep 21;14:1257906. doi: 10.3389/fimmu.2023.1257906. eCollection 2023. Front Immunol. 2023. PMID: 37809087 Free PMC article.
-
Reduced serum IgG galactosylation is associated with increased inflammation during relapses of neuromyelitis optica spectrum disorders.Front Immunol. 2024 Mar 21;15:1357475. doi: 10.3389/fimmu.2024.1357475. eCollection 2024. Front Immunol. 2024. PMID: 38576616 Free PMC article.
-
Anti-TNF Biologicals Enhance the Anti-Inflammatory Properties of IgG N-Glycome in Crohn's Disease.Biomolecules. 2023 Jun 7;13(6):954. doi: 10.3390/biom13060954. Biomolecules. 2023. PMID: 37371534 Free PMC article.
-
The importance of IgG glycosylation-What did we learn after analyzing over 100,000 individuals.Immunol Rev. 2024 Nov;328(1):143-170. doi: 10.1111/imr.13407. Epub 2024 Oct 4. Immunol Rev. 2024. PMID: 39364834 Free PMC article. Review.
-
Immunoglobulin G N-Glycosylation and Inflammatory Factors: Analysis of Biomarkers for the Diagnosis of Moyamoya Disease.J Inflamm Res. 2025 Apr 24;18:5447-5462. doi: 10.2147/JIR.S512707. eCollection 2025. J Inflamm Res. 2025. PMID: 40297543 Free PMC article.
References
-
- Effenberger M., Reider S., Waschina S., Bronowski C., Enrich B., Adolph T.E., Koch R., Moschen A.R., Rosenstiel P., Aden K., et al. Microbial Butyrate Synthesis Indicates Therapeutic Efficacy of Azathioprine in IBD Patients. J. Crohns. Colitis. 2021;15:88–98. doi: 10.1093/ecco-jcc/jjaa152. - DOI - PubMed
-
- Aden K., Rehman A., Waschina S., Pan W.H., Walker A., Lucio M., Nunez A.M., Bharti R., Zimmerman J., Bethge J., et al. Metabolic Functions of Gut Microbes Associate with Efficacy of Tumor Necrosis Factor Antagonists in Patients with Inflammatory Bowel Diseases. Gastroenterology. 2019;157:1279–1292.e11. doi: 10.1053/j.gastro.2019.07.025. - DOI - PubMed
-
- Derer S., Till A., Haesler R., Sina C., Grabe N., Jung S., Nikolaus S., Kuehbacher T., Groetzinger J., Rose-John S., et al. MTNF Reverse Signalling Induced by TNFα Antagonists Involves a GDF-1 Dependent Pathway: Implications for Crohn’s Disease. Gut. 2013;62:376–386. doi: 10.1136/gutjnl-2011-300384. - DOI - PubMed
MeSH terms
Substances
Grants and funding
LinkOut - more resources
Full Text Sources
