

Early Expression of Tet1 and Tet2 in Mouse Zygotes Altered DNA Methylation Status and Affected Embryonic Development
- PMID: 35955629
- PMCID: PMC9369288
- DOI: 10.3390/ijms23158495
Early Expression of Tet1 and Tet2 in Mouse Zygotes Altered DNA Methylation Status and Affected Embryonic Development
Abstract
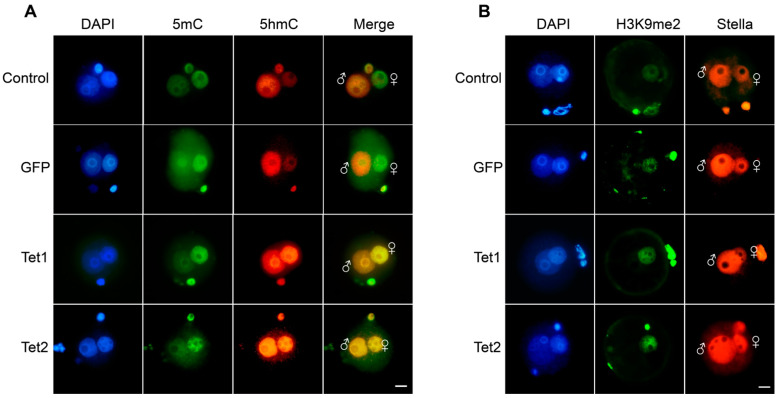
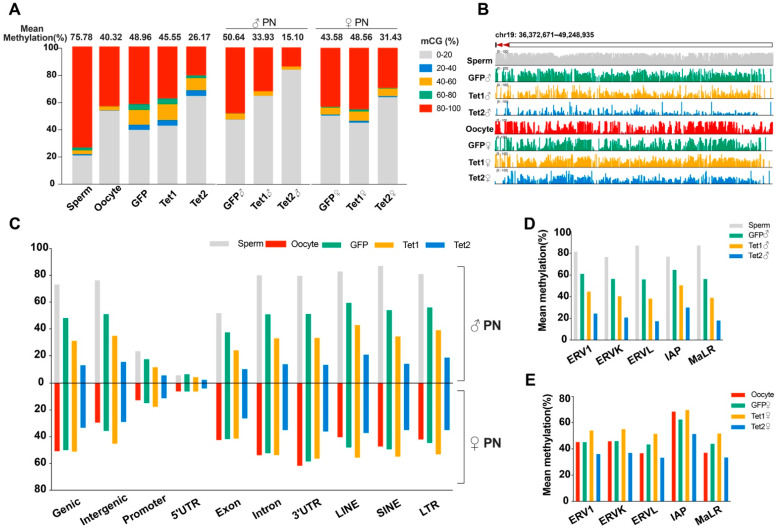
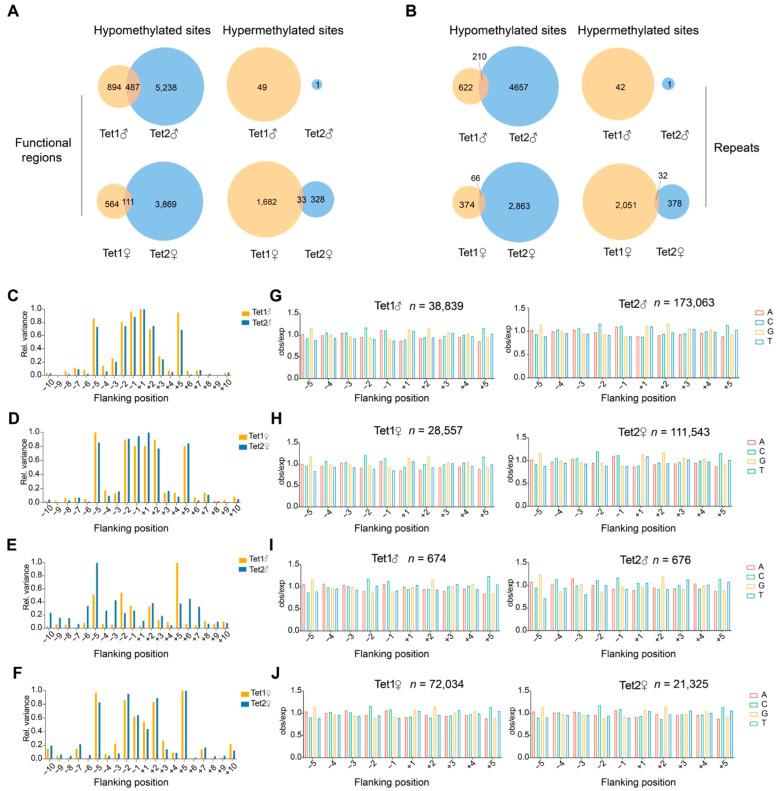
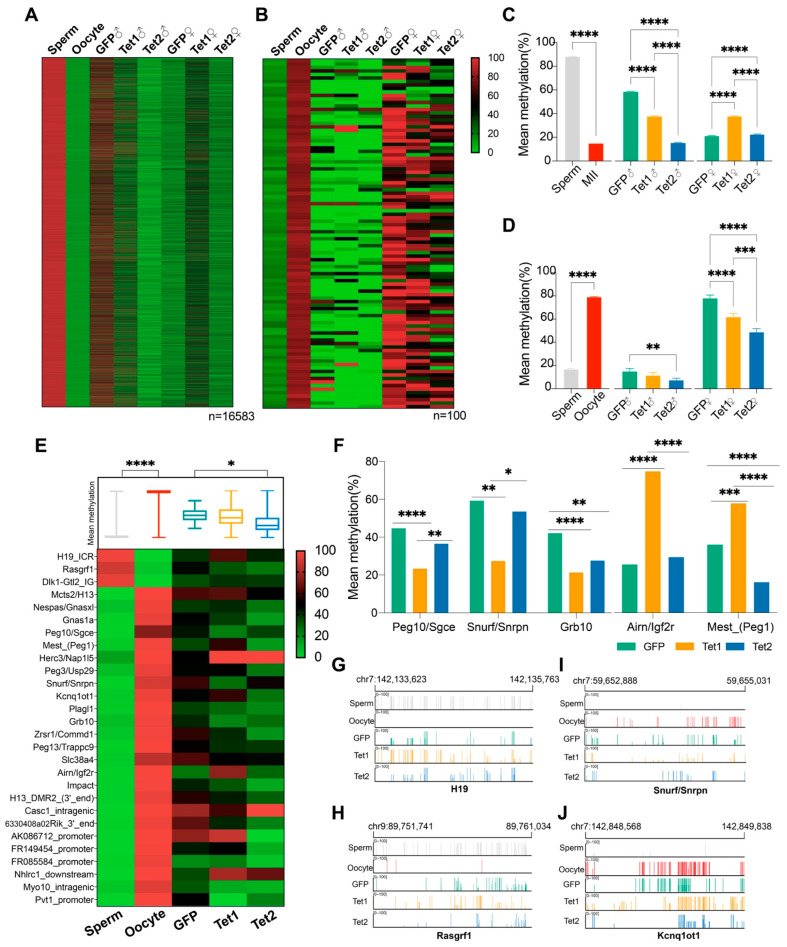
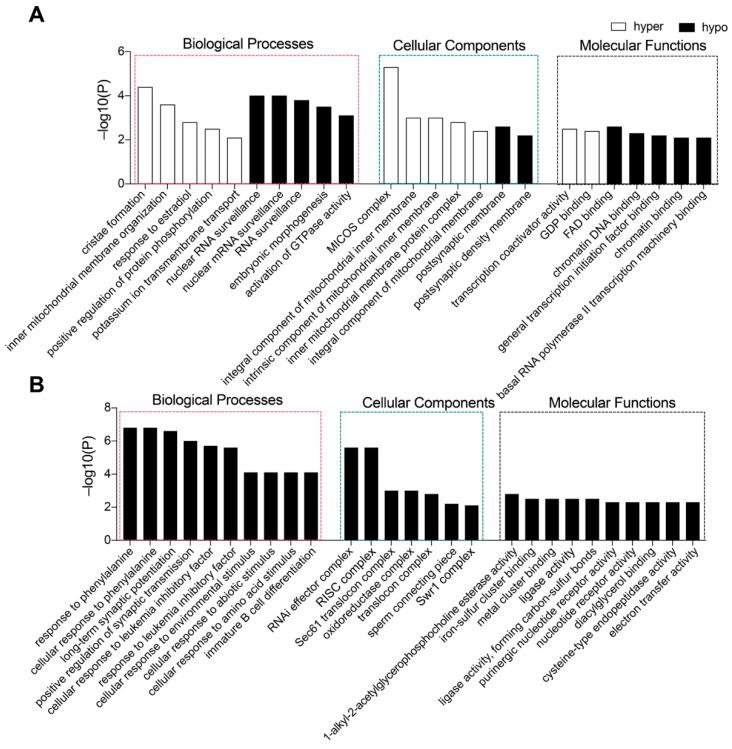
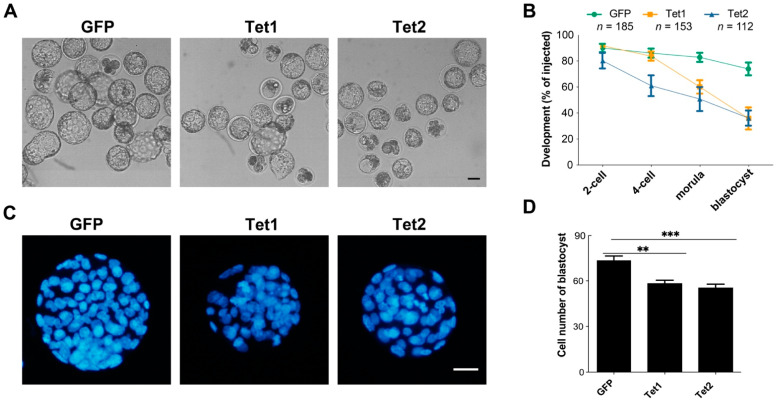
Ten-eleven translocation (Tet) dioxygenases can induce DNA demethylation by catalyzing 5-methylcytosine(5mC) to 5-hydroxymethylcytosine(5hmC), and play important roles during mammalian development. In mouse, Tet1 and Tet2 are not expressed in pronucleus-staged embryos and are not involved in the genomic demethylation of early zygotes. Here, we investigated the influence of Tet1 and Tet2 on methylation of parental genomes by ectopically expressing Tet1 and Tet2 in zygotes. Immunofluorescence staining showed a marked 5hmC increase in the maternal pronucleus after injection of Tet1 or Tet2 mRNA into zygotes. Whole-genome bisulfite sequencing further revealed that Tet2 greatly enhanced the global demethylation of both parental genomes, while Tet1 only promoted the paternal demethylation. Tet1 and Tet2 overexpression altered the DNA methylation across genomes, including various genic elements and germline-specific differently methylated regions. Tet2 exhibited overall stronger demethylation activity than Tet1. Either Tet1 or Tet2 overexpression impaired preimplantation embryonic development. These results demonstrated that early expression of Tet1 and Tet2 could substantially alter the zygotic methylation landscape and damage embryonic development. These findings provide new insights into understanding the function of Tet dioxygenases and the mechanism of DNA methylation in relation to embryogenesis.
Keywords: DNA methylation; Tet1; Tet2; embryonic development; mice; zygotes.
Conflict of interest statement
The authors declare no conflict of interest.
Figures
Similar articles
-
Comparative dynamics of 5-methylcytosine reprogramming and TET family expression during preimplantation mammalian development in mouse and sheep.Theriogenology. 2017 Feb;89:86-96. doi: 10.1016/j.theriogenology.2016.10.010. Epub 2016 Oct 20. Theriogenology. 2017. PMID: 28043375
-
MYC deregulates TET1 and TET2 expression to control global DNA (hydroxy)methylation and gene expression to maintain a neoplastic phenotype in T-ALL.Epigenetics Chromatin. 2019 Jul 2;12(1):41. doi: 10.1186/s13072-019-0278-5. Epigenetics Chromatin. 2019. PMID: 31266538 Free PMC article.
-
Distinct roles of the methylcytosine oxidases Tet1 and Tet2 in mouse embryonic stem cells.Proc Natl Acad Sci U S A. 2014 Jan 28;111(4):1361-6. doi: 10.1073/pnas.1322921111. Epub 2014 Jan 13. Proc Natl Acad Sci U S A. 2014. PMID: 24474761 Free PMC article.
-
Tet family of 5-methylcytosine dioxygenases in mammalian development.J Hum Genet. 2013 Jul;58(7):421-7. doi: 10.1038/jhg.2013.63. Epub 2013 May 30. J Hum Genet. 2013. PMID: 23719188 Free PMC article. Review.
-
TET proteins and 5-methylcytosine oxidation in hematological cancers.Immunol Rev. 2015 Jan;263(1):6-21. doi: 10.1111/imr.12239. Immunol Rev. 2015. PMID: 25510268 Free PMC article. Review.
Cited by
-
TET1: The epigenetic architect of clinical disease progression.Genes Dis. 2025 Jan 4;12(5):101513. doi: 10.1016/j.gendis.2025.101513. eCollection 2025 Sep. Genes Dis. 2025. PMID: 40520993 Free PMC article. Review.
References
MeSH terms
Substances
Grants and funding
LinkOut - more resources
Full Text Sources
