

Proteomics Evidence of a Systemic Response to Desiccation in the Resurrection Plant Haberlea rhodopensis
- PMID: 35955654
- PMCID: PMC9369045
- DOI: 10.3390/ijms23158520
Proteomics Evidence of a Systemic Response to Desiccation in the Resurrection Plant Haberlea rhodopensis
Abstract
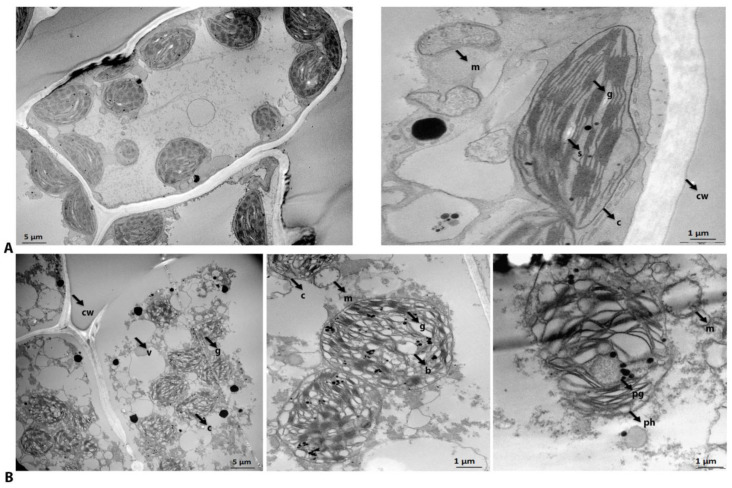
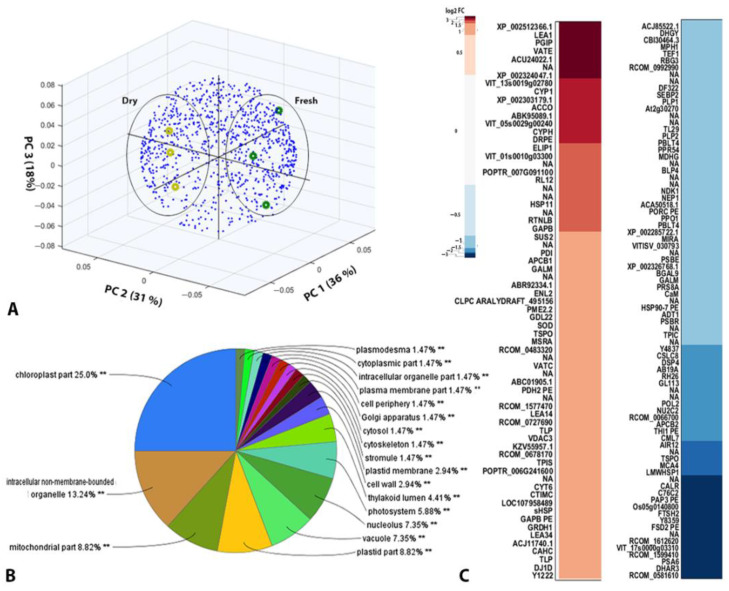
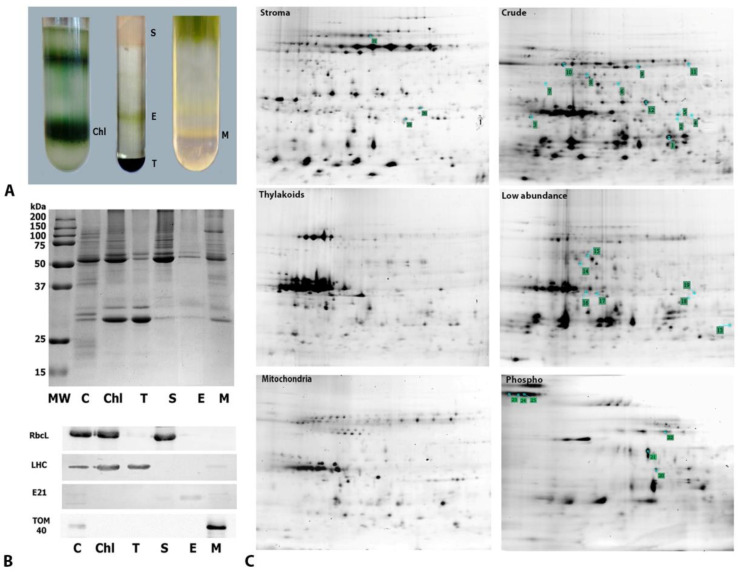
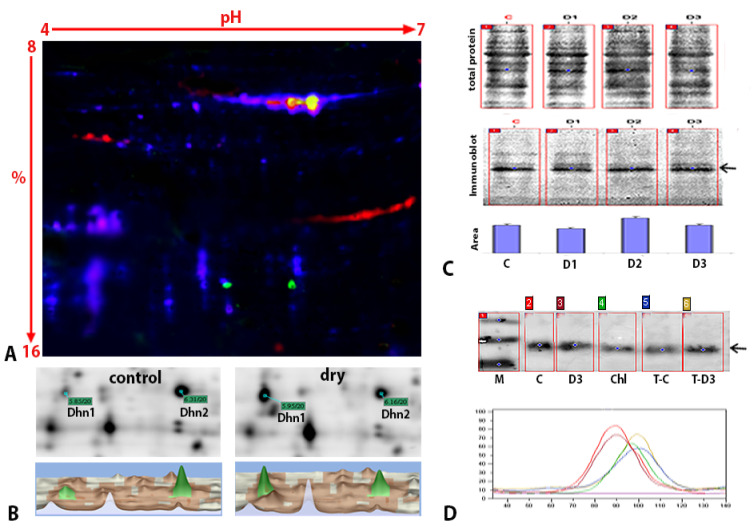
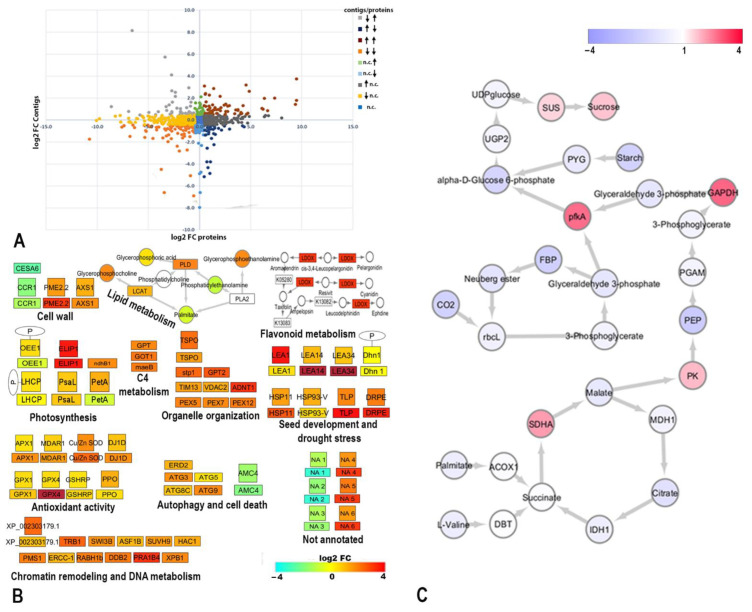
Global warming and drought stress are expected to have a negative impact on agricultural productivity. Desiccation-tolerant species, which are able to tolerate the almost complete desiccation of their vegetative tissues, are appropriate models to study extreme drought tolerance and identify novel approaches to improve the resistance of crops to drought stress. In the present study, to better understand what makes resurrection plants extremely tolerant to drought, we performed transmission electron microscopy and integrative large-scale proteomics, including organellar and phosphorylation proteomics, and combined these investigations with previously published transcriptomic and metabolomics data from the resurrection plant Haberlea rhodopensis. The results revealed new evidence about organelle and cell preservation, posttranscriptional and posttranslational regulation, photosynthesis, primary metabolism, autophagy, and cell death in response to desiccation in H. rhodopensis. Different protective intrinsically disordered proteins, such as late embryogenesis abundant (LEA) proteins, thaumatin-like proteins (TLPs), and heat shock proteins (HSPs), were detected. We also found a constitutively abundant dehydrin in H. rhodopensis whose phosphorylation levels increased under stress in the chloroplast fraction. This integrative multi-omics analysis revealed a systemic response to desiccation in H. rhodopensis and certain targets for further genomic and evolutionary studies on DT mechanisms and genetic engineering towards the improvement of drought tolerance in crops.
Keywords: dehydrin; drought stress; proteomics; resurrection plant; subcellular fractionation; systems biology.
Conflict of interest statement
We have no conflict of interest to disclose.
Figures
Similar articles
-
Dynamics of chromatin accessibility and genome wide control of desiccation tolerance in the resurrection plant Haberlea rhodopensis.BMC Plant Biol. 2023 Dec 19;23(1):654. doi: 10.1186/s12870-023-04673-2. BMC Plant Biol. 2023. PMID: 38110858 Free PMC article.
-
Specific metabolic and cellular mechanisms of the vegetative desiccation tolerance in resurrection plants for adaptation to extreme dryness.Planta. 2024 Jan 29;259(2):47. doi: 10.1007/s00425-023-04323-9. Planta. 2024. PMID: 38285274 Review.
-
Molecular mechanisms of desiccation tolerance in the resurrection glacial relic Haberlea rhodopensis.Cell Mol Life Sci. 2013 Feb;70(4):689-709. doi: 10.1007/s00018-012-1155-6. Epub 2012 Sep 21. Cell Mol Life Sci. 2013. PMID: 22996258 Free PMC article.
-
Analysis of the complete mitochondrial genome sequence of the resurrection plant Haberlea rhodopensis.Acta Biochim Pol. 2021 May 12;68(2):277-286. doi: 10.18388/abp.2020_5555. Acta Biochim Pol. 2021. PMID: 33979512
-
Molecular mechanisms of desiccation tolerance in resurrection plants.Cell Mol Life Sci. 2012 Oct;69(19):3175-86. doi: 10.1007/s00018-012-1088-0. Epub 2012 Jul 26. Cell Mol Life Sci. 2012. PMID: 22833170 Free PMC article. Review.
Cited by
-
Protein Changes in Shade and Sun Haberlea rhodopensis Leaves during Dehydration at Optimal and Low Temperatures.Plants (Basel). 2023 Jan 15;12(2):401. doi: 10.3390/plants12020401. Plants (Basel). 2023. PMID: 36679114 Free PMC article.
-
Differential Accumulation of sHSPs Isoforms during Desiccation of the Resurrection Plant Haberlea rhodopensis Friv. under Optimal and High Temperature.Life (Basel). 2023 Jan 14;13(1):238. doi: 10.3390/life13010238. Life (Basel). 2023. PMID: 36676187 Free PMC article.
-
Acquisition of Freezing Tolerance of Resurrection Species from Gesneriaceae, a Comparative Study.Plants (Basel). 2023 May 5;12(9):1893. doi: 10.3390/plants12091893. Plants (Basel). 2023. PMID: 37176950 Free PMC article.
-
Dynamics of chromatin accessibility and genome wide control of desiccation tolerance in the resurrection plant Haberlea rhodopensis.BMC Plant Biol. 2023 Dec 19;23(1):654. doi: 10.1186/s12870-023-04673-2. BMC Plant Biol. 2023. PMID: 38110858 Free PMC article.
-
Specific metabolic and cellular mechanisms of the vegetative desiccation tolerance in resurrection plants for adaptation to extreme dryness.Planta. 2024 Jan 29;259(2):47. doi: 10.1007/s00425-023-04323-9. Planta. 2024. PMID: 38285274 Review.
References
-
- Huang J., Ji M., Xie Y., Wang S., He Y., Ran J. Global Semi-Arid Climate Change over Last 60 Years. Clim. Dyn. 2016;46:1131–1150. doi: 10.1007/s00382-015-2636-8. - DOI
-
- Spinoni J., Barbosa P., Cherlet M., Forzieri G., McCormick N., Naumann G., Vogt J.V., Dosio A. How Will the Progressive Global Increase of Arid Areas Affect Population and Land-Use in the 21st Century? Glob. Planet. Chang. 2021;205:103597. doi: 10.1016/j.gloplacha.2021.103597. - DOI
-
- Oliver M.J., Tuba Z., Mishler B.D. The evolution of vegetative desiccation tolerance in land plants. Plant Ecol. 2000;151:85–100. doi: 10.1023/A:1026550808557. - DOI
MeSH terms
Grants and funding
LinkOut - more resources
Full Text Sources
