

Pharmacological and In Silico Analysis of Oat Avenanthramides as EGFR Inhibitors: Effects on EGF-Induced Lung Cancer Cell Growth and Migration
- PMID: 35955669
- PMCID: PMC9369115
- DOI: 10.3390/ijms23158534
Pharmacological and In Silico Analysis of Oat Avenanthramides as EGFR Inhibitors: Effects on EGF-Induced Lung Cancer Cell Growth and Migration
Abstract
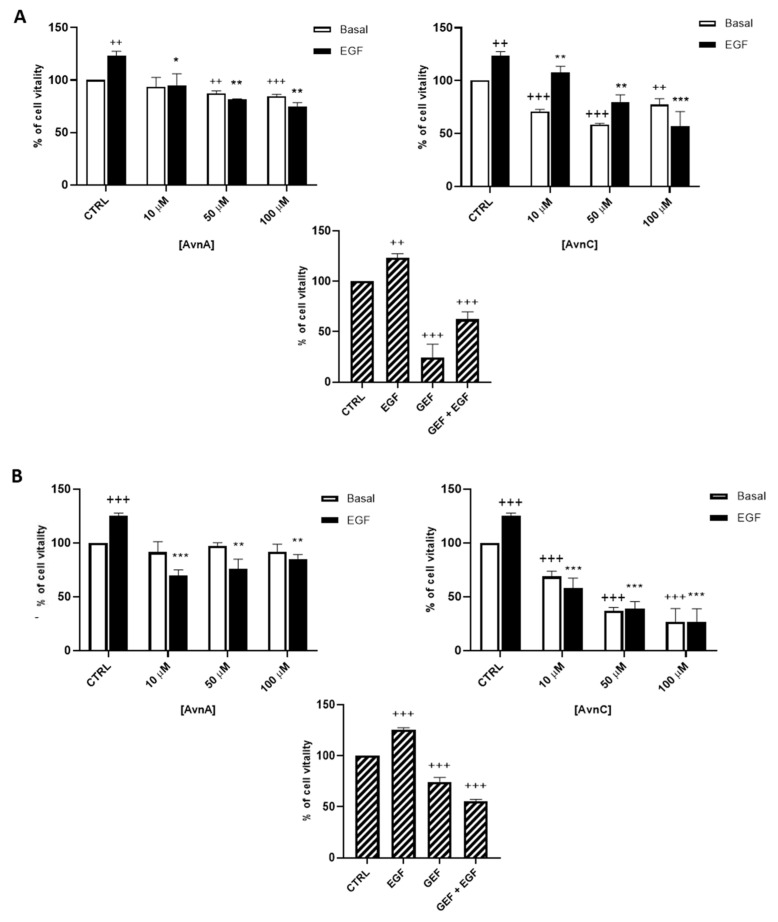
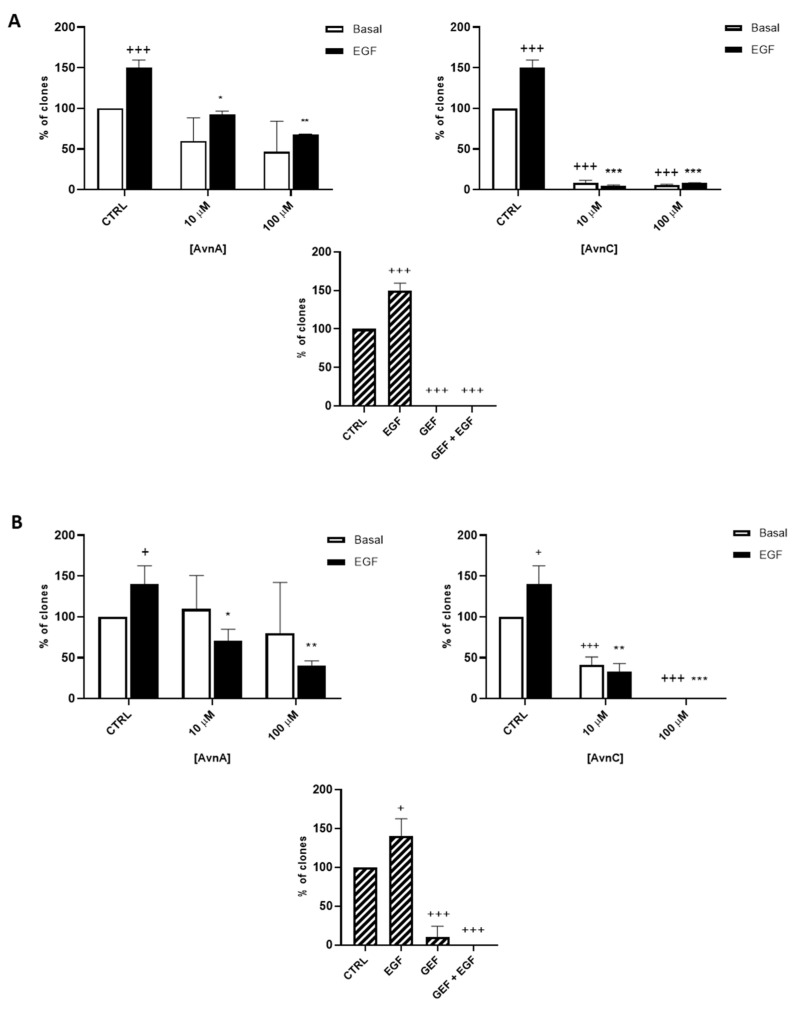
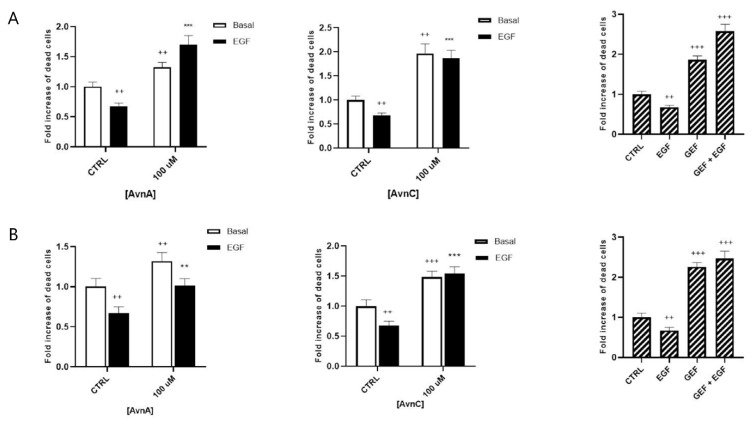
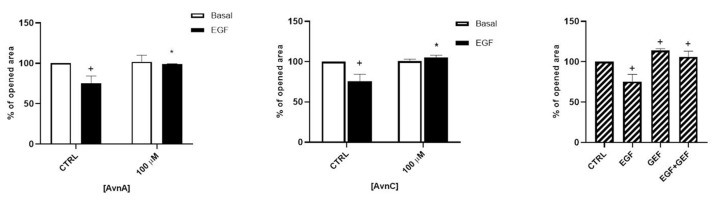
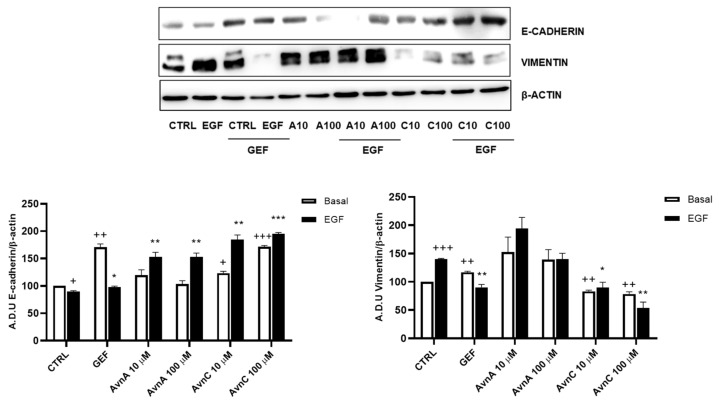
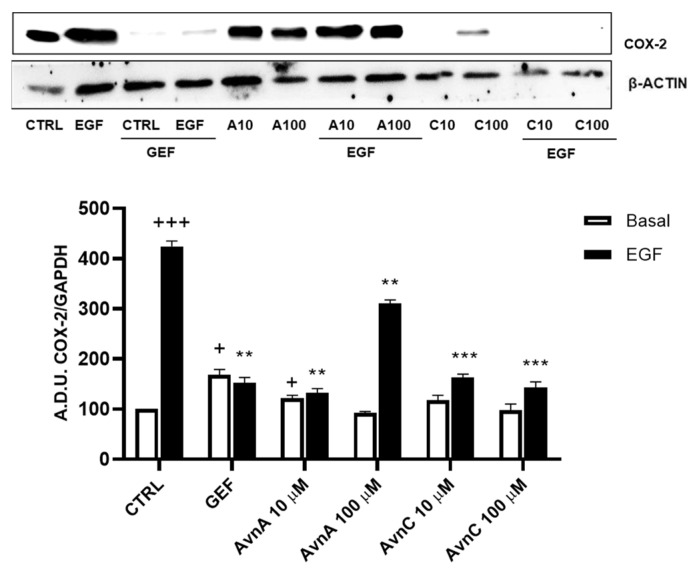
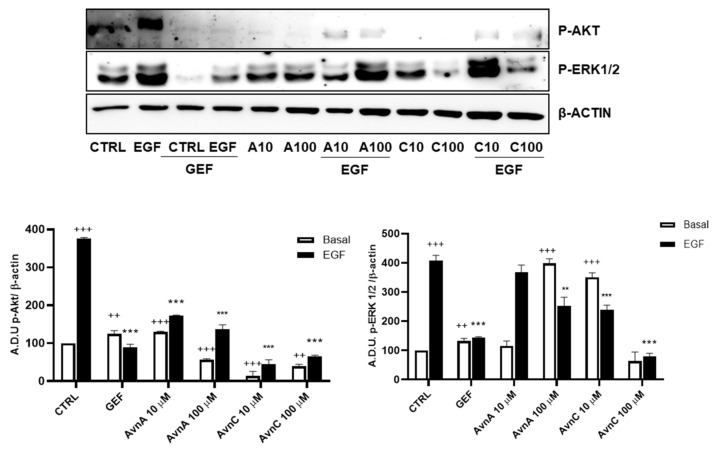
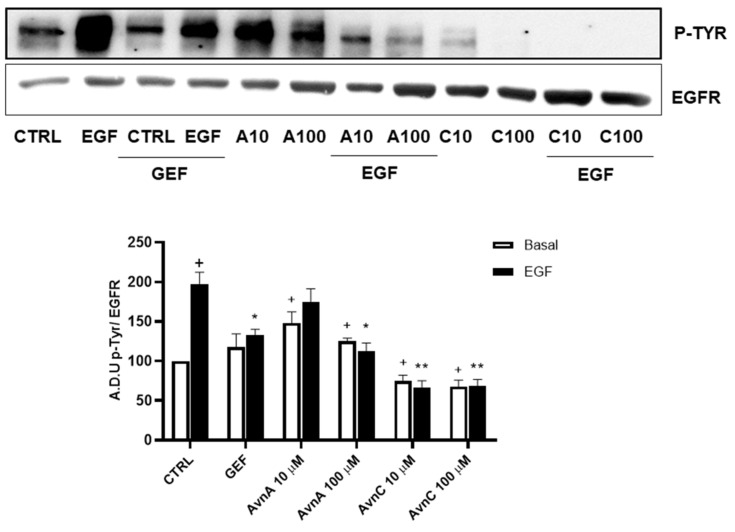
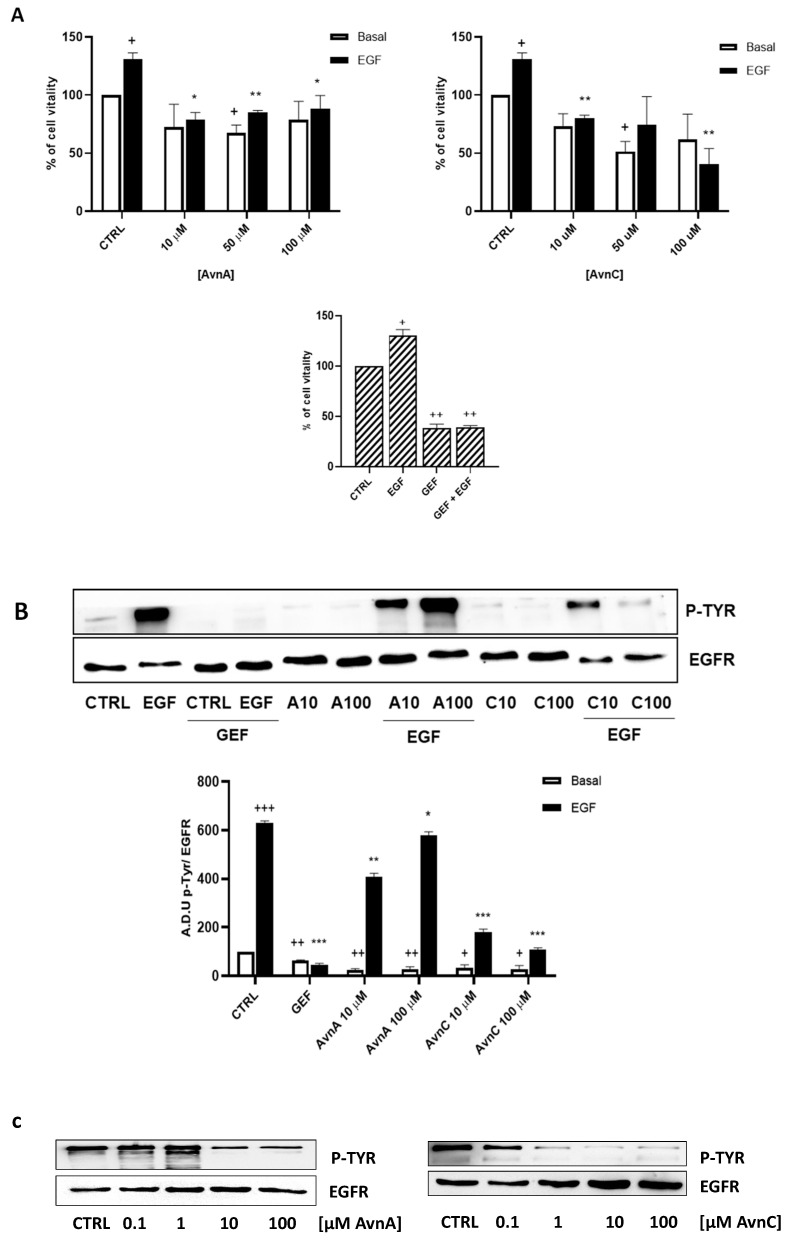
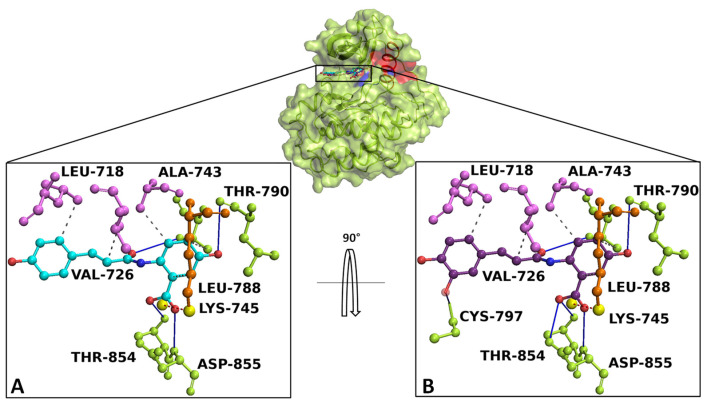
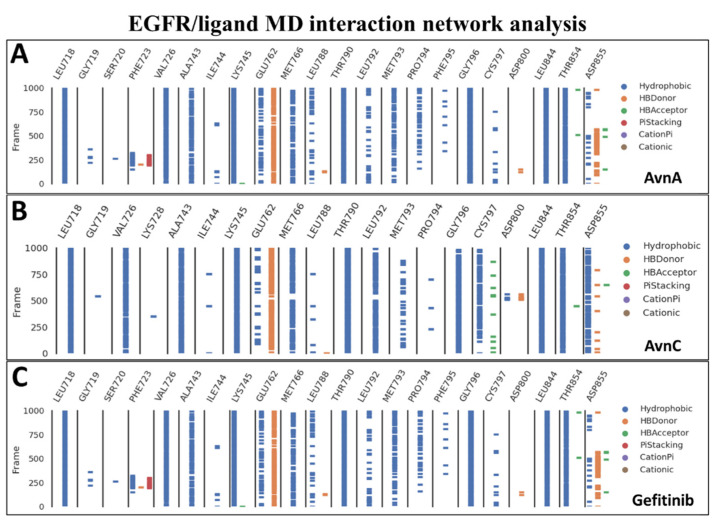
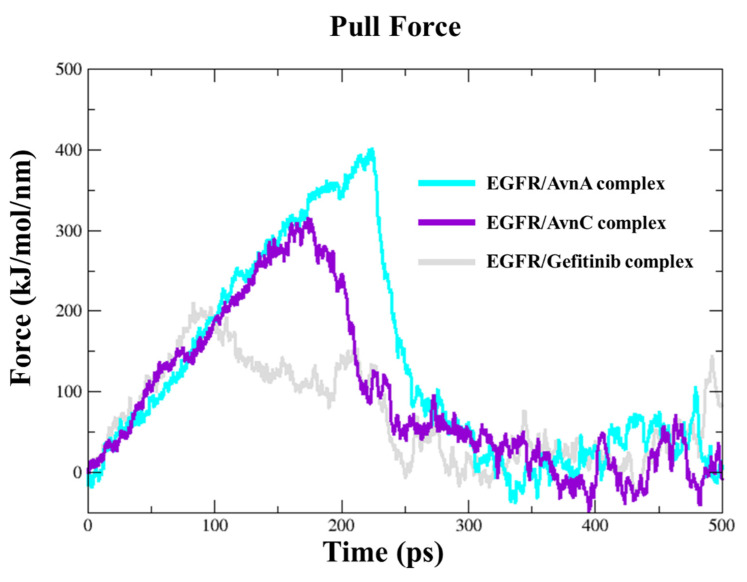
Avena sativa L. is a wholegrain cereal and an important edible crop. Oats possesses high nutritional and health promoting values and contains high levels of bioactive compounds, including a group of phenolic amides, named avenanthramides (Avns), exerting antioxidant, anti-inflammatory, and anticancer activities. Epidermal growth factor receptor (EGFR) represents one of the most known oncogenes and it is frequently up-regulated or mutated in human cancers. The oncogenic effects of EGFR include enhanced cell growth, angiogenesis, and metastasis, and down-regulation or inhibition of EGFR signaling has therapeutic benefit. Front-line EGFR tyrosine kinase inhibitor therapy is the standard therapy for patients with EGFR-mutated lung cancer. However, the clinical effects of EGFR inhibition may be lost after a few months of treatment due to the onset of resistance. Here, we showed the anticancer activity of Avns, focusing on EGFR activation and signaling pathway. Lung cancer cellular models have been used to evaluate the activity of Avns on tumor growth, migration, EMT, and anoikis induced by EGF. In addition, docking and molecular dynamics simulations showed that the Avns bind with high affinity to a region in the vicinity of αC-helix and the DGF motif of EGFR, jeopardizing the target biological function. Altogether, our results reveal a new pharmacological activity of Avns as EGFR tyrosine kinase inhibitors.
Keywords: EGFR; avenanthramide C; avenanthramides; classical molecular dynamics simulation; docking simulation; lung cancer; steered molecular dynamics simulation.
Conflict of interest statement
The authors declare no conflict of interest.
Figures
Similar articles
-
Phenolic amides (avenanthramides) in oats - an update review.Bioengineered. 2024 Dec;15(1):2305029. doi: 10.1080/21655979.2024.2305029. Epub 2024 Jan 23. Bioengineered. 2024. PMID: 38258524 Free PMC article. Review.
-
Analysis of avenanthramides in oat products and estimation of avenanthramide intake in humans.Food Chem. 2018 Jul 1;253:93-100. doi: 10.1016/j.foodchem.2018.01.138. Food Chem. 2018. PMID: 29502849
-
Comprehensive study of the effect of oat grain germination on the content of avenanthramides.Food Chem. 2024 Mar 30;437(Pt 1):137807. doi: 10.1016/j.foodchem.2023.137807. Epub 2023 Oct 20. Food Chem. 2024. PMID: 37871428
-
The Progress of Nomenclature, Structure, Metabolism, and Bioactivities of Oat Novel Phytochemical: Avenanthramides.J Agric Food Chem. 2022 Jan 19;70(2):446-457. doi: 10.1021/acs.jafc.1c05704. Epub 2022 Jan 7. J Agric Food Chem. 2022. PMID: 34994561 Review.
-
Yeast-Derived Recombinant Avenanthramides Inhibit Proliferation, Migration and Epithelial Mesenchymal Transition of Colon Cancer Cells.Nutrients. 2018 Aug 24;10(9):1159. doi: 10.3390/nu10091159. Nutrients. 2018. PMID: 30149546 Free PMC article.
Cited by
-
Potential Human Health Benefits of Phaseolus vulgaris L. var Venanzio: Effects on Cancer Cell Growth and Inflammation.Nutrients. 2024 Aug 2;16(15):2534. doi: 10.3390/nu16152534. Nutrients. 2024. PMID: 39125413 Free PMC article.
-
Targeting Staphylococcal Cell-Wall Biosynthesis Protein FemX Through Steered Molecular Dynamics and Drug-Repurposing Approach.ACS Omega. 2023 Aug 2;8(32):29292-29301. doi: 10.1021/acsomega.3c02691. eCollection 2023 Aug 15. ACS Omega. 2023. PMID: 37599983 Free PMC article.
-
Cooperation between Prostaglandin E2 and Epidermal Growth Factor Receptor in Cancer Progression: A Dual Target for Cancer Therapy.Cancers (Basel). 2023 Apr 19;15(8):2374. doi: 10.3390/cancers15082374. Cancers (Basel). 2023. PMID: 37190301 Free PMC article. Review.
-
Disintegrin-like Protein Strategy to Inhibit Aggressive Triple-Negative Breast Cancer.Int J Mol Sci. 2023 Jul 30;24(15):12219. doi: 10.3390/ijms241512219. Int J Mol Sci. 2023. PMID: 37569595 Free PMC article.
-
Nutritional Value Improvement of Oats by Solid-State Fermentation with Monascus purpureus.Foods. 2025 May 11;14(10):1703. doi: 10.3390/foods14101703. Foods. 2025. PMID: 40428483 Free PMC article.
References
-
- Perrelli A., Goitre L., Salzano A.M., Moglia A., Scaloni A., Retta S.F. Biological Activities, Health Benefits, and Therapeutic Properties of Avenanthramides: From Skin Protection to Prevention and Treatment of Cerebrovascular Diseases. Oxid. Med. Cell. Longev. 2018;2018:6015351. doi: 10.1155/2018/6015351. - DOI - PMC - PubMed
MeSH terms
Substances
Grants and funding
LinkOut - more resources
Full Text Sources
Medical
Research Materials
Miscellaneous
