Time-Dependent DNA Origami Denaturation by Guanidinium Chloride, Guanidinium Sulfate, and Guanidinium Thiocyanate
- PMID: 35955680
- PMCID: PMC9368935
- DOI: 10.3390/ijms23158547
Time-Dependent DNA Origami Denaturation by Guanidinium Chloride, Guanidinium Sulfate, and Guanidinium Thiocyanate
Abstract
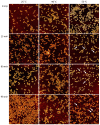
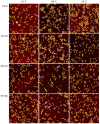
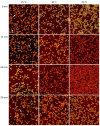
Guanidinium (Gdm) undergoes interactions with both hydrophilic and hydrophobic groups and, thus, is a highly potent denaturant of biomolecular structure. However, our molecular understanding of the interaction of Gdm with proteins and DNA is still rather limited. Here, we investigated the denaturation of DNA origami nanostructures by three Gdm salts, i.e., guanidinium chloride (GdmCl), guanidinium sulfate (Gdm2SO4), and guanidinium thiocyanate (GdmSCN), at different temperatures and in dependence of incubation time. Using DNA origami nanostructures as sensors that translate small molecular transitions into nanostructural changes, the denaturing effects of the Gdm salts were directly visualized by atomic force microscopy. GdmSCN was the most potent DNA denaturant, which caused complete DNA origami denaturation at 50 °C already at a concentration of 2 M. Under such harsh conditions, denaturation occurred within the first 15 min of Gdm exposure, whereas much slower kinetics were observed for the more weakly denaturing salt Gdm2SO4 at 25 °C. Lastly, we observed a novel non-monotonous temperature dependence of DNA origami denaturation in Gdm2SO4 with the fraction of intact nanostructures having an intermediate minimum at about 40 °C. Our results, thus, provide further insights into the highly complex Gdm-DNA interaction and underscore the importance of the counteranion species.
Keywords: DNA nanotechnology; DNA origami; atomic force microscopy; denaturation; guanidinium.
Conflict of interest statement
The authors declare no conflict of interest. The funders had no role in the design of the study; in the collection, analyses, or interpretation of data; in the writing of the manuscript, or in the decision to publish the results.
Figures


Similar articles
-
Superstructure-dependent stability of DNA origami nanostructures in the presence of chaotropic denaturants.Nanoscale. 2023 Oct 26;15(41):16590-16600. doi: 10.1039/d3nr02045b. Nanoscale. 2023. PMID: 37747200
-
The reversal by sulfate of the denaturant activity of guanidinium.J Am Chem Soc. 2007 Dec 26;129(51):15895-902. doi: 10.1021/ja074719j. Epub 2007 Dec 4. J Am Chem Soc. 2007. PMID: 18052164
-
Nanometer-scale ion aggregates in aqueous electrolyte solutions: guanidinium sulfate and guanidinium thiocyanate.J Phys Chem B. 2005 Dec 22;109(50):24185-96. doi: 10.1021/jp052799c. J Phys Chem B. 2005. PMID: 16375411
-
Cation-Induced Stabilization and Denaturation of DNA Origami Nanostructures in Urea and Guanidinium Chloride.Small. 2017 Nov;13(44). doi: 10.1002/smll.201702100. Epub 2017 Oct 12. Small. 2017. PMID: 29024433
-
Structural stability of DNA origami nanostructures under application-specific conditions.Comput Struct Biotechnol J. 2018 Sep 18;16:342-349. doi: 10.1016/j.csbj.2018.09.002. eCollection 2018. Comput Struct Biotechnol J. 2018. PMID: 30305885 Free PMC article. Review.
Cited by
-
70% ethanol preserves mycobacterial RNA from cultures more efficiently than GTC-TCEP.Sci Rep. 2025 Apr 10;15(1):12322. doi: 10.1038/s41598-025-93699-7. Sci Rep. 2025. PMID: 40210664 Free PMC article.
-
An inhibitor-free, versatile, fast, and cheap precipitation-based DNA purification method.PLoS One. 2025 Apr 8;20(4):e0317658. doi: 10.1371/journal.pone.0317658. eCollection 2025. PLoS One. 2025. PMID: 40198694 Free PMC article.
References
-
- Xin Y., Piskunen P., Suma A., Li C., Ijäs H., Ojasalo S., Seitz I., Kostiainen M.A., Grundmeier G., Linko V., et al. Environment-Dependent Stability and Mechanical Properties of DNA Origami Six-Helix Bundles with Different Crossover Spacings. Small. 2022;18:2107393. doi: 10.1002/smll.202107393. - DOI - PubMed
MeSH terms
Substances
Grants and funding
LinkOut - more resources
Full Text Sources

