. 2022 Aug 2;23(15):8558.
doi: 10.3390/ijms23158558.

Metabolic Effects of the Waist-To-Hip Ratio Associated Locus GRB14/COBLL1 Are Related to GRB14 Expression in Adipose Tissue

Affiliations

Metabolic Effects of the Waist-To-Hip Ratio Associated Locus GRB14/COBLL1 Are Related to GRB14 Expression in Adipose Tissue

Chang Sun et al. Int J Mol Sci. .

Abstract

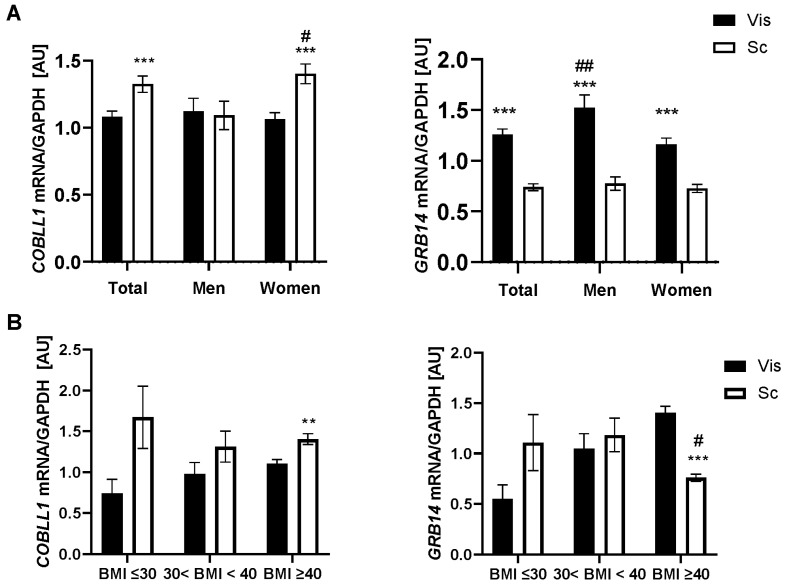
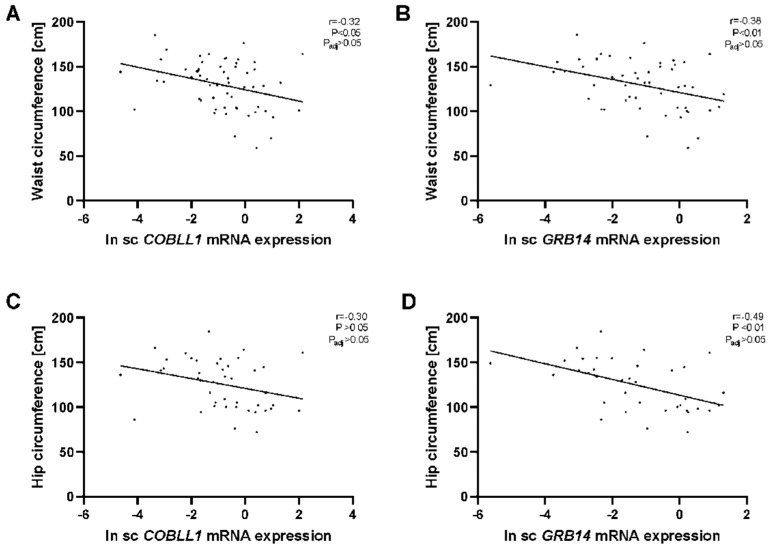
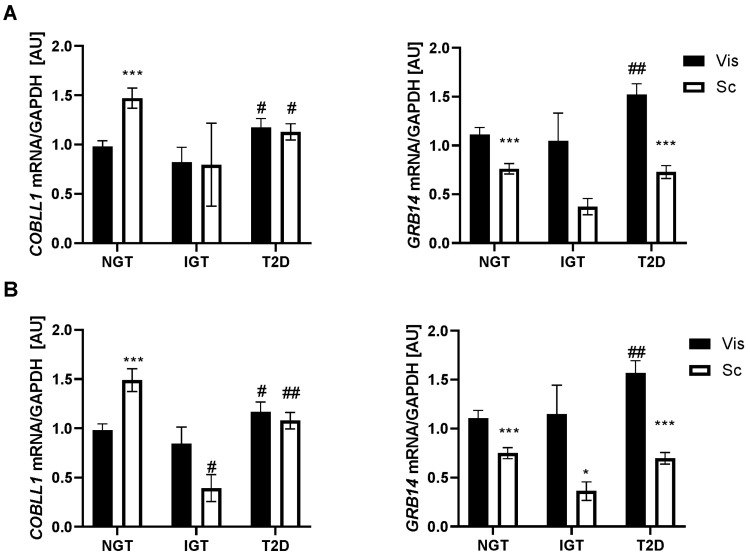
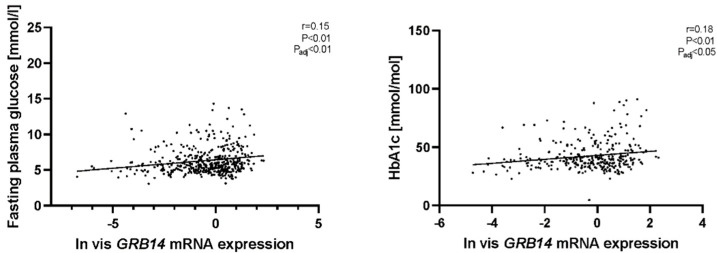
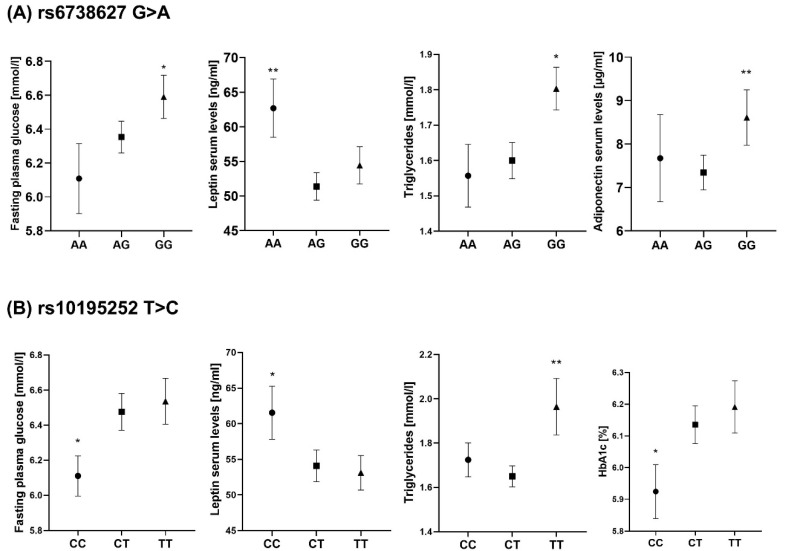
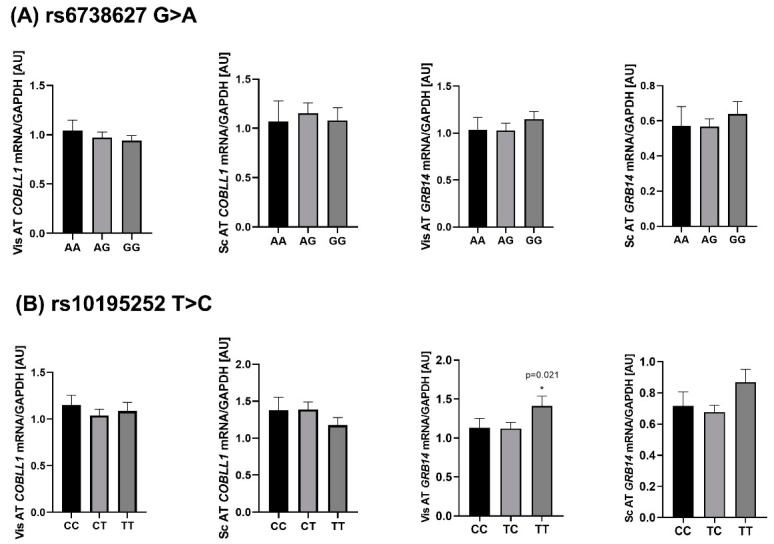
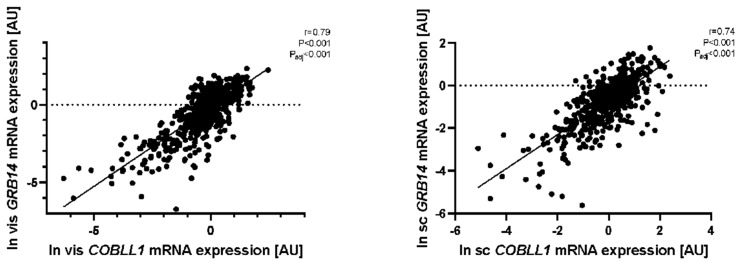
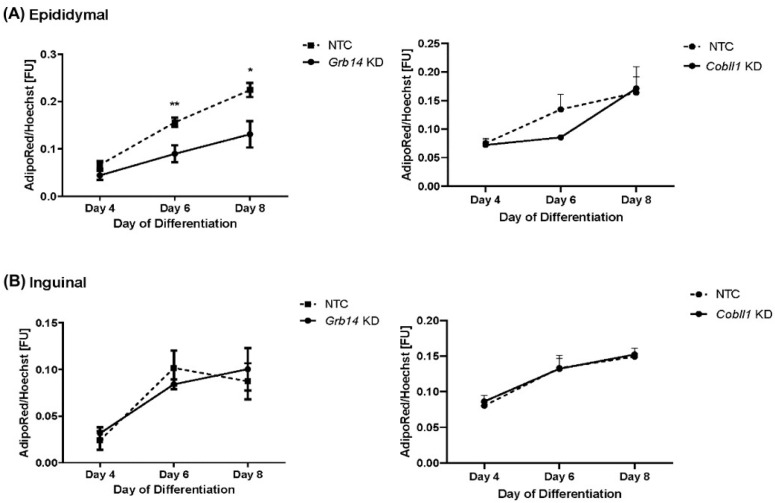
GRB14/COBLL1 locus has been shown to be associated with body fat distribution (FD), but neither the causal gene nor its role in metabolic diseases has been elucidated. We hypothesize that GRB14/COBLL1 may act as the causal genes for FD-related SNPs (rs10195252 and rs6738627), and that they may be regulated by SNP to effect obesity-related metabolic traits. We genotyped rs10195252 and rs6738627 in 2860 subjects with metabolic phenotypes. In a subgroup of 560 subjects, we analyzed GRB14/COBLL1 gene expression in paired visceral and subcutaneous adipose tissue (AT) samples. Mediation analyses were used to determine the causal relationship between SNPs, AT GRB14/COBLL1 mRNA expression, and obesity-related traits. In vitro gene knockdown of Grb14/Cobll1 was used to test their role in adipogenesis. Both gene expressions in AT are correlated with waist circumference. Visceral GRB14 mRNA expression is associated with FPG and HbA1c. Both SNPs are associated with triglycerides, FPG, and leptin levels. Rs10195252 is associated with HbA1c and seems to be mediated by visceral AT GRB14 mRNA expression. Our data support the role of the GRB14/COBLL1 gene expression in body FD and its locus in metabolic sequelae: in particular, lipid metabolism and glucose homeostasis, which is likely mediated by AT GRB14 transcript levels.

Keywords: COBLL1; GRB14; adipose tissue; rs10195252; rs6738627.


Conflict of interest statement

The authors declared no conflict of interest.

Figures

Figure 1
Figure 1
(A) COBLL1 and GRB14 mRNA expression in 524/560 paired human visceral (vis) and subcutaneous (sc) adipose tissue (AT) samples in the total cohort and grouped by sex (131/149 men, 393/411 women). Data are shown as mean ± SEM; *** for comparisons between sc and vis fat depot expression; # for comparison between men and women in the same AT depot; # p < 0.05; ## p< 0.01; *** p < 0.001. (B) COBLL1 and GRB14 mRNA expression in paired human visceral (vis) and subcutaneous (sc) adipose tissue (AT) samples grouped by obesity status (BMI < 30 kg/m2, n = 19; 30 ≤ BMI < 40 kg/m2, n = 47; BMI ≥ 40 kg/m2, n = 454). Mean ± SEM; ** sc vs. vis AT depot; # 30–40 kg/m2 ≥ 40 kg/m2 vs. <30 kg/m2 depot; # p < 0.05; ** p < 0.01; *** p < 0.001.
Figure 2
Figure 2
Correlation between AT COBLL1/GRB14 mRNA expression and fat distribution variables. The correlation of natural log transformed sc COBLL1/GRB14 mRNA levels with waist circumference (A,B, n = 59/53) and hip circumference (C,D, n = 43/37) is shown. Pearson correlation coefficients and corresponding p-value have been included; padj: adjusted by BMI, age, and sex; sc: subcutaneous adipose tissue.
Figure 3
Figure 3
(A) COBLL1 and GRB14 mRNA expression in paired human visceral (vis) and subcutaneous (sc) adipose tissue (AT) samples grouped by type 2 diabetes status (NGT: subjects with normal glucose tolerance, n = 238; IGT: subjects with impaired glucose tolerance, n = 10; subjects with Type 2 diabetes, n = 197). Mean ± SEM; *vis vs. sc AT depot; #IGT/T2D vs. NGT; # p < 0.05; ## p < 0.01; *** p < 0.001. (B) COBLL1 and GRB14 mRNA in paired human visceral (vis) and subcutaneous (sc) adipose tissue (AT) samples grouped by type 2 diabetes status in BMI ≥ 40 kg/m2 patients. (NGT: subjects with normal glucose tolerance, n = 200; IGT: subjects with impaired glucose tolerance, n = 9; T2D: subjects with diabetes, n = 175). Mean ± SEM; *vis vs. sc AT depot; #IGT/T2D vs. NGT; */# p < 0.05; ## p < 0.01; *** p < 0.001.
Figure 4
Figure 4
Correlation between vis AT GRB14 mRNA expression glucose variables. The correlation of natural log transformed vis GRB14 mRNA levels with fasting plasma glucose (n = 473) and glycated haemoglobin (HbA1c) (n = 309) is shown. Pearson correlation coefficients and corresponding p-value have been included; padj: adjusted by BMI, age, and sex; vis: visceral adipose tissue.
Figure 5
Figure 5
Association analyses of rs6738627 and rs10195252 with metabolic traits. (A) Association analyses of rs6738627 with FPG, leptin, TG, and adiponectin. (B) Association analyses of rs10195252 with FPG, leptin, TG, and HbA1c. * p < 0.05; ** p < 0.01; p adjusted for sex, age, and BMI.
Figure 6
Figure 6
Association of rs6738627 and rs10195252 with COBLL1 and GRB14 mRNA expression in visceral (vis) and subcutaneous (sc) AT. (A) shows the rs6738627 associated with COBLL1 and GRB14 mRNA expression in both ATs. (B) shows the rs10195252 associated with COBLL1 and GRB14 mRNA expression in both ATs. Data are given as arithmetic mean ± SEM; p < 0.05 in additive mode of inheritance; adjusted for sex, age, BMI.
Figure 7
Figure 7
The correlation of GRB14 and COBLL1 mRNA expression in visceral (vis) and subcutaneous (sc) AT. The correlation of natural log transformed vis COBLL1/GRB14 mRNA levels (n = 563) and sc COBLL1/GRB14 mRNA (n = 486) are shown. Pearson correlation coefficients and corresponding p-value have been included; padj: adjusted by BMI, age, and sex.
Figure 8
Figure 8
Quantification of lipid droplets by measuring the AdipoRedTM fluorescence signal normalized to the Hoechst fluorescence signal. Lipid droplets quantification (A) in the epididymal cell line and (B) in the inguinal cell line. Lipid accumulation normalized to the Hoechst signal compared to NTC (non-silencing siRNA group). AdipoRed stains the triglycerides of the lipid droplets and Hoechst stains the nuclei of cells. KD: knock-down. * p < 0.05, ** p < 0.01.

Similar articles

Cited by

References

    1. Heymsfield S.B., Wadden T.A. Mechanisms, Pathophysiology, and Management of Obesity. N. Engl. J. Med. 2017;376:254–266. doi: 10.1056/NEJMra1514009. - DOI - PubMed
    1. Khera A.V., Chaffin M., Wade K.H., Zahid S., Brancale J., Xia R., Distefano M., Senol-Cosar O., Haas M.E., Bick A., et al. Polygenic Prediction of Weight and Obesity Trajectories from Birth to Adulthood. Cell. 2019;177:587–596.e9. doi: 10.1016/j.cell.2019.03.028. - DOI - PMC - PubMed
    1. Khera A.V., Chaffin M., Aragam K.G., Haas M.E., Roselli C., Choi S.H., Natarajan P., Lander E.S., Lubitz S.A., Ellinor P.T., et al. Genome-wide polygenic scores for common diseases identify individuals with risk equivalent to monogenic mutations. Nat. Genet. 2018;50:1219–1224. doi: 10.1038/s41588-018-0183-z. - DOI - PMC - PubMed
    1. Sun C., Kovacs P., Guiu-Jurado E. Genetics of Obesity in East Asians. Front. Genet. 2020;11:575049. doi: 10.3389/fgene.2020.575049. - DOI - PMC - PubMed
    1. Sun C., Kovacs P., Guiu-Jurado E. Genetics of Body Fat Distribution: Comparative Analyses in Populations with European, Asian and African Ancestries. Genes. 2021;12:841. doi: 10.3390/genes12060841. - DOI - PMC - PubMed

LinkOut - more resources