. 2022 Aug 3;23(15):8603.
doi: 10.3390/ijms23158603.

Downregulation of IL-8 and IL-10 by the Activation of Ca2+-Activated K+ Channel KCa3.1 in THP-1-Derived M2 Macrophages

Affiliations

Downregulation of IL-8 and IL-10 by the Activation of Ca2+-Activated K+ Channel KCa3.1 in THP-1-Derived M2 Macrophages

Susumu Ohya et al. Int J Mol Sci. .

Abstract

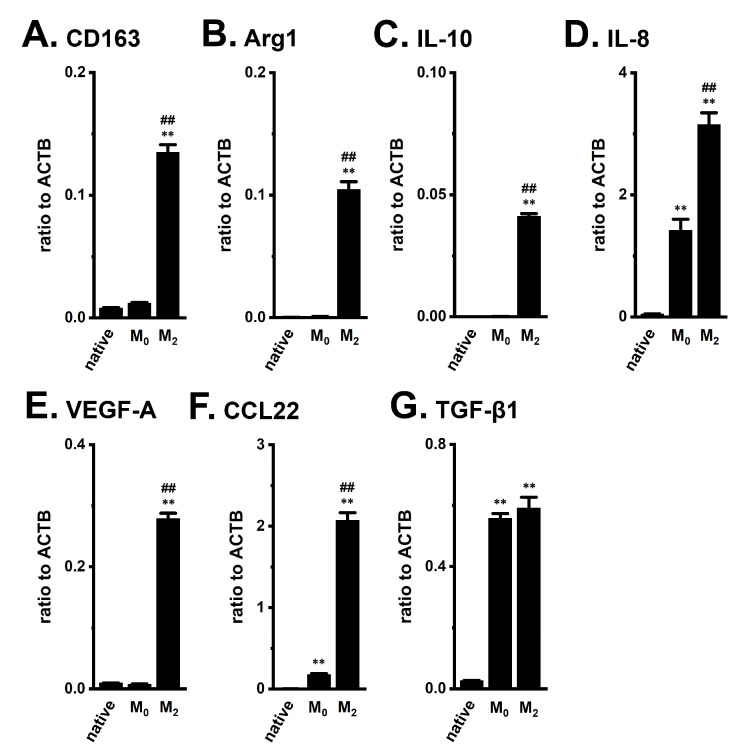
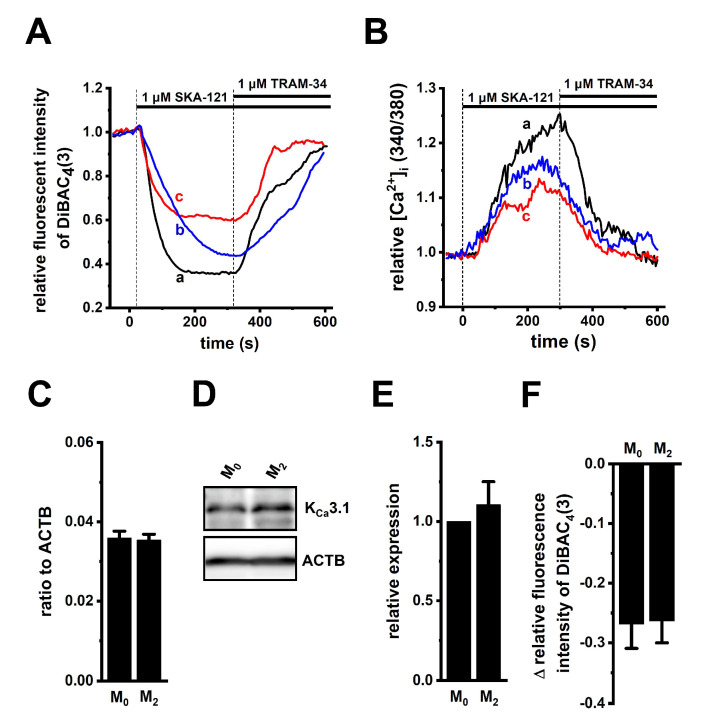
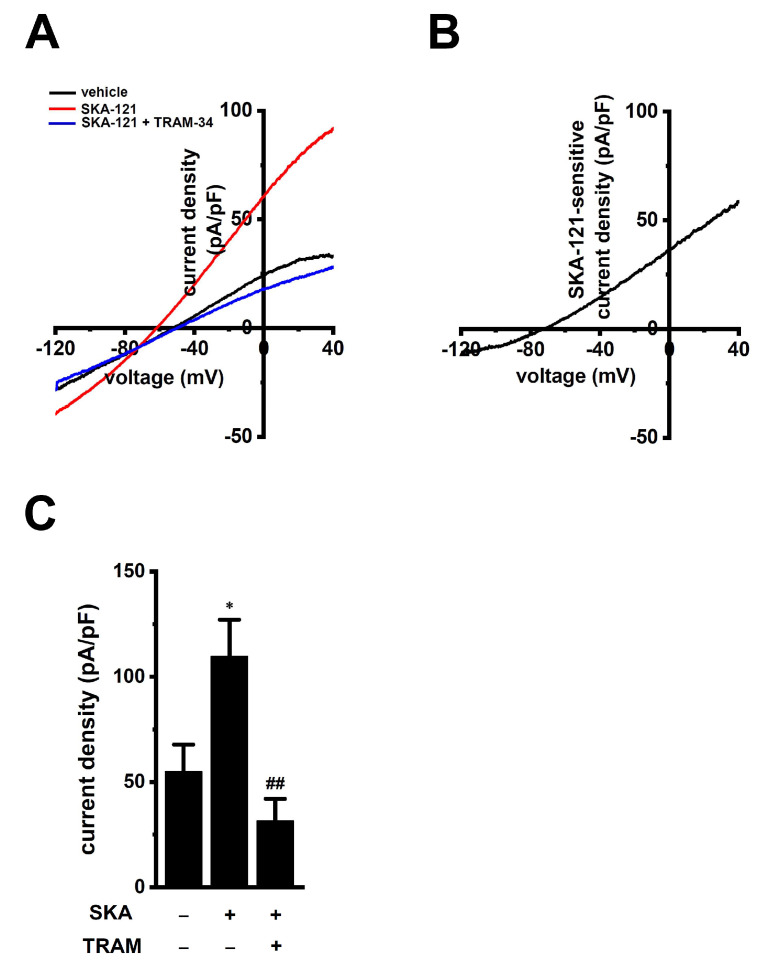
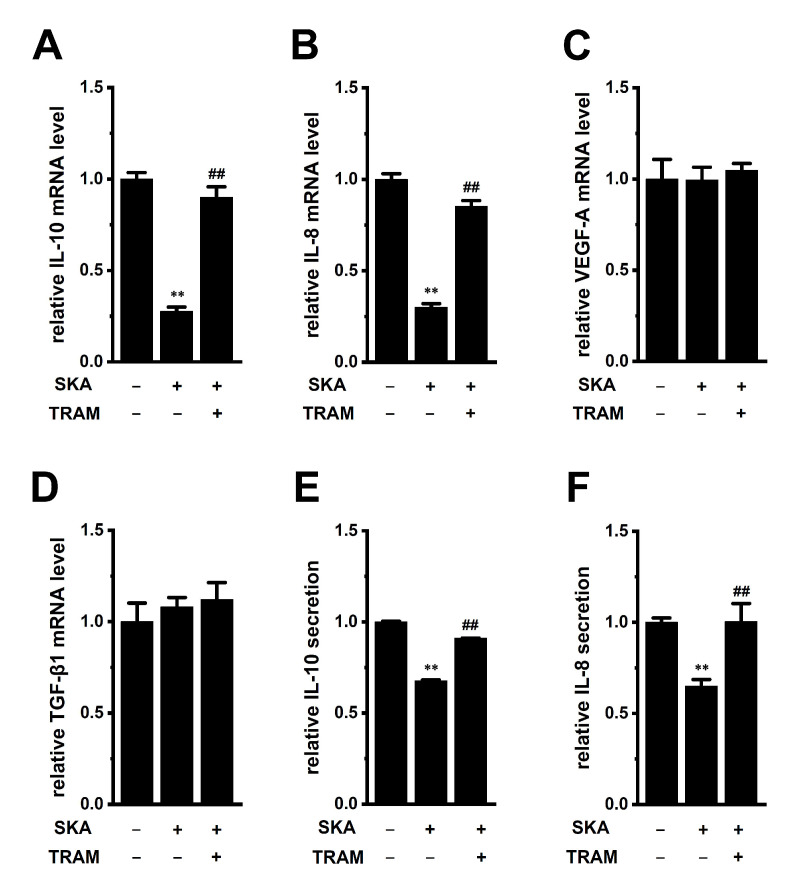
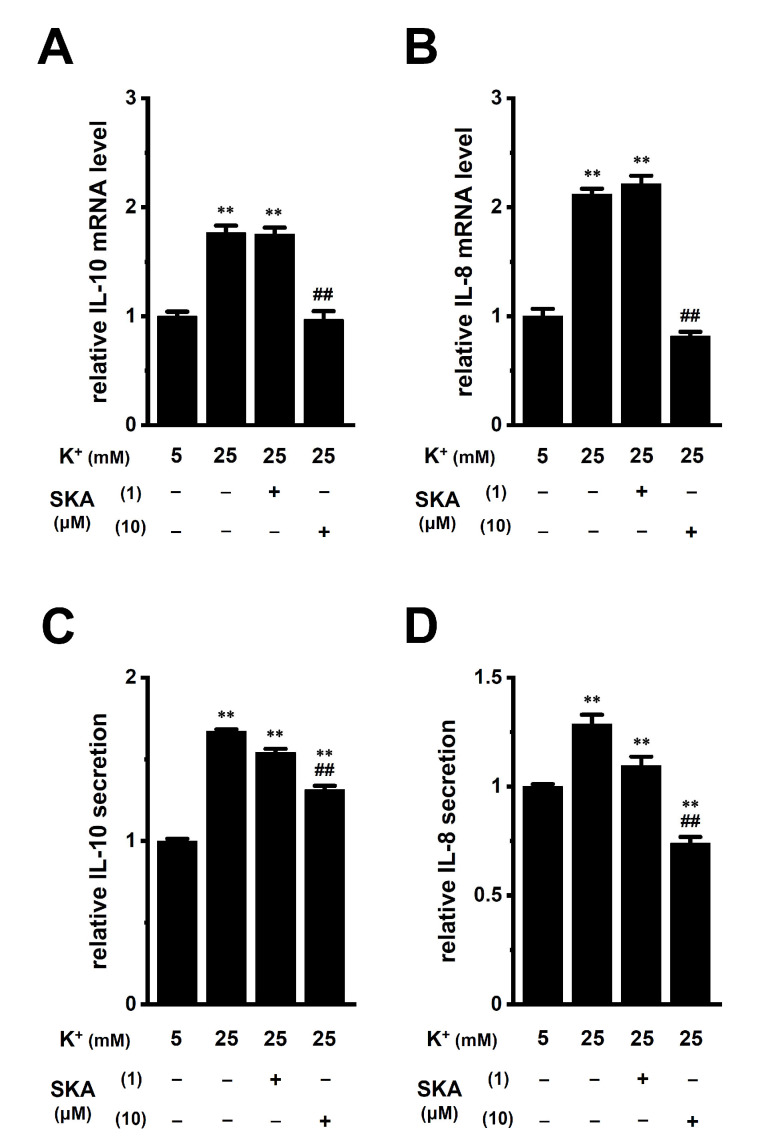
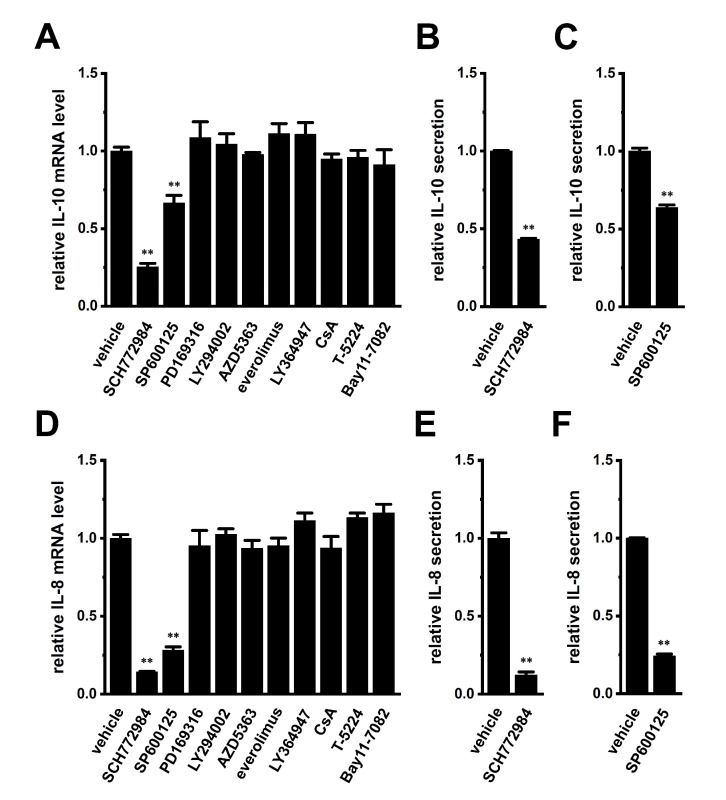
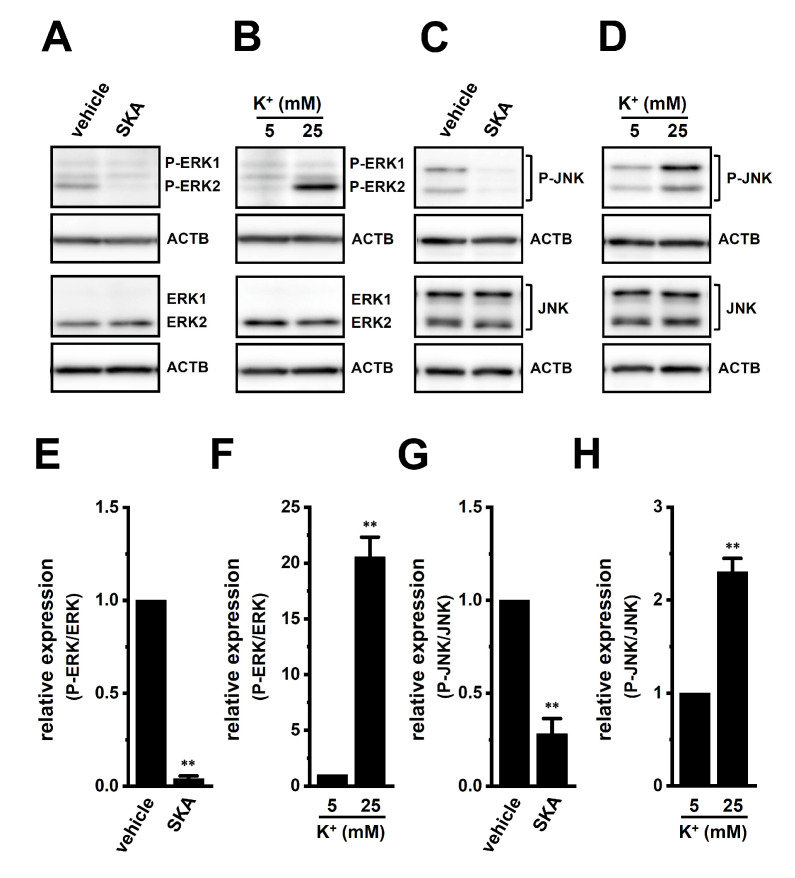
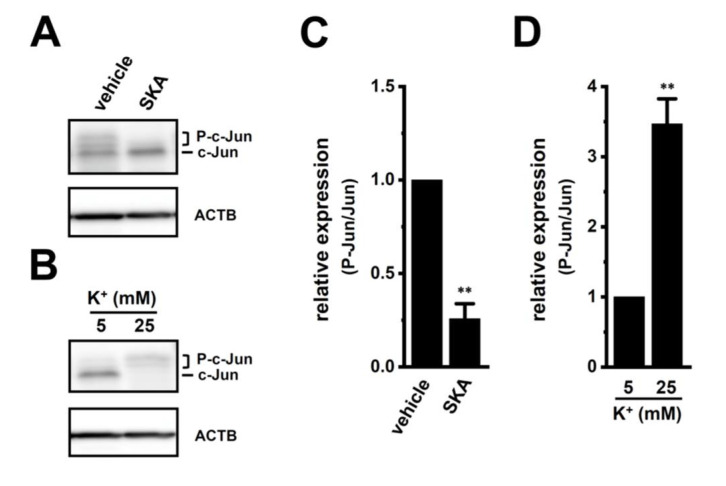
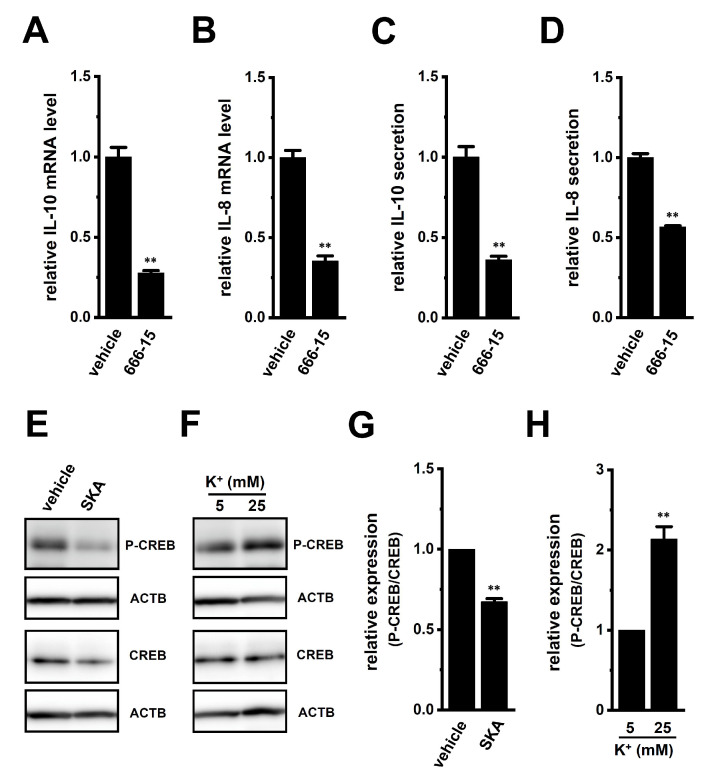
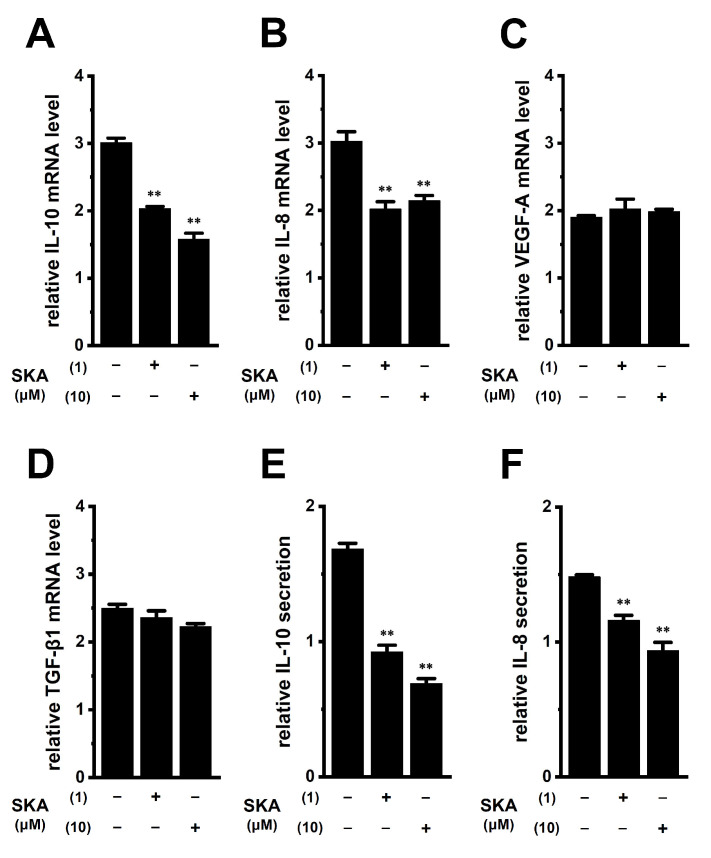
THP-1-differentiated macrophages are useful for investigating the physiological significance of tumor-associated macrophages (TAMs). In the tumor microenvironment (TME), TAMs with the M2-like phenotype play a critical role in promoting cancer progression and metastasis by inhibiting the immune surveillance system. We examined the involvement of Ca2+-activated K+ channel KCa3.1 in TAMs in expressing pro-tumorigenic cytokines and angiogenic growth factors. In THP-1-derived M2 macrophages, the expression levels of IL-8 and IL-10 were significantly decreased by treatment with the selective KCa3.1 activator, SKA-121, without changes in those of VEGF and TGF-β1. Furthermore, under in vitro experimental conditions that mimic extracellular K+ levels in the TME, IL-8 and IL-10 levels were both significantly elevated, and these increases were reversed by combined treatment with SKA-121. Among several signaling pathways potentially involved in the transcriptional regulation of IL-8 and IL-10, respective treatments with ERK and JNK inhibitors significantly repressed their transcriptions, and treatment with SKA-121 significantly reduced the phosphorylated ERK, JNK, c-Jun, and CREB levels. These results strongly suggest that the KCa3.1 activator may suppress IL-10-induced tumor immune surveillance escape and IL-8-induced tumorigenicity and metastasis by inhibiting their production from TAMs through ERK-CREB and JNK-c-Jun cascades.

Keywords: IL-10; IL-8; K+ channel; KCa3.1; THP-1; tumor microenvironment; tumor-associated macrophage.


Conflict of interest statement

The authors declare no conflict of interest.

Figures

Figure 1
Figure 1
Gene expression of M2 markers, cytokines, chemokines, and growth factors in THP-1-derived M2-like macrophages. AG: Real-time PCR examination of CD163 (A), Arg1 (B), IL-10 (C), IL-8 (D), VEGF-A (E), CCL22 (F), and TGF-β1 (G) expression in native THP-1 (‘native’), THP-1-derived M0-like macrophages (‘M0’), and THP-1-derived M2-like macrophages (‘M2’). Expression levels are shown as a ratio to ACTB (n = 4 for each). **: p < 0.01 vs. ‘native’, ##: p < 0.01 vs. ‘M0’.
Figure 2
Figure 2
Functional expression of KCa3.1 in THP-1-derived M2 macrophages. (A,B): Simultaneous measurements of changes in the membrane potential (A) and [Ca2+]i (B) in the three different cells [a (black), b (blue), and c (red)], following the application of a selective KCa3.1 activator, SKA-121 (1 μM), and/or the KCa3.1 inhibitor, TRAM-34 (1 μM) using DiBAC4(3) and Fura 2, respectively. The relative time-course changes in fluorescence intensities (1.0 at 0 s) from three different THP-1-derived M2 macrophages are shown. (C): Real-time PCR examination of KCa3.1 expression in THP-1-derived M0 macrophages (‘M0’) and M2 macrophages (‘M2’). Expression levels are shown as a ratio to ACTB (p > 0.05, n = 4 for each). (D,E): Protein expression levels of KCa3.1 in the ‘M0’ and ‘M2’ groups were determined by Western blot. Specific band signals for KCa3.1 were observed at approximately 50 kDa (D, upper panel). After compensation with the optical density of the ACTB signal (43 kDa) (D, lower panel), the expression level in the ‘M0’ group was expressed as 1.0 (p > 0.05, n = 4 for each) (E). (F): SKA-121 (1 μM)-induced relative hyperpolarizing responses in the ‘M0’ and ‘M2’ groups (p > 0.05, n = 37 and 29, respectively).
Figure 3
Figure 3
Whole-cell patch-clamp recordings of SKA-121-activated K+ currents in THP-1-derived M2 macrophages. (A): Typical current density and voltage-relationships after addition of vehicle (black), 1 μM SKA-121 (red), and 1 μM SKA-121 plus 1 μM TRAM-34 (blue). Currents were elicited by ramp depolarization from −120 to +40 mV from a holding potential of −80 mV every 10 s. (B): Typical current density and voltage-relationship of SKA-121-sensitive component. (C): Summarized results of current densities (pA/pF) at +40 mV in three groups (n = 9 for each). *: p < 0.05 vs. vehicle control (−/−); ## p < 0.01 vs. SKA-121 alone (+/−).
Figure 4
Figure 4
Effects of treatment with SKA-121 on IL-10, IL-8, VEGF-A, and TGF-β1 expression and on IL-10 and IL-8 secretion in THP-1-derived M2 macrophages. A–D: Real-time PCR examination of IL-10 (A), IL-8 (B), VEGF-A (C), and TGF-β1 (D) expression in THP-1-derived M2 macrophages treated (+) or untreated (−) with 1 μM SKA-121 and 10 μM TRAM-34 for 24 h. Relative mRNA expression in the vehicle control (‘−’ for SKA and ‘−’ for TRAM) is expressed as 1.0 (n = 4 for each). (E,F): Quantitative detection of IL-10 (E) and IL-8 (F) secretion by an ELISA assay in THP-1-derived M2 macrophages treated and untreated with SKA-121 and TRAM-34. Relative cytokine secretion in the vehicle control (−/−) is expressed as 1.0 (n = 4 for each). **: p < 0.01 vs. the vehicle control (−/−), ##: p < 0.01 vs. SKA-121 alone (+/−).
Figure 5
Figure 5
Effects of treatment with SKA-121 on high [K+]e-enhanced IL-10 and IL-8 expression and secretion in THP-1-derived M2 macrophages. A,B: Real-time PCR examination of IL-10 (A) and IL-8 (B) expression in normal [K+]e (5 mM)- and high [K+]e (25 mM)-treated THP-1-derived M2 macrophages for 24 h in the presence (+) or absence (−) of SKA-121 (1, 10 μM). Relative mRNA expression in normal [K+]e is expressed as 1.0 (n = 4 for each). (C,D): Quantitative detection of IL-10 (C) and IL-8 (D) secretion by an ELISA assay in THP-1-derived M2 macrophages treated and untreated with SKA-121. Relative cytokine secretion in normal [K+]e is expressed as 1.0 (n = 4 for each). **: p < 0.01 vs. normal [K+]e, ##: p < 0.01 vs. the vehicle control (−/−) of high [K+]e.
Figure 6
Figure 6
Effects of a 24 h treatment with various signaling pathway inhibitors on IL-10 and IL-8 expression and effects of the 24 h treatment with the ERK1/2 inhibitor, SCH772984 and JNK inhibitor, SP600125 on IL-10 and IL-8 secretion in THP-1-derived M2 macrophages. (A,D): Real-time PCR examination of IL-10 (A) and IL-8 (D) expression in SCH772964 (1 μM)-, SP600125 (10 μM)-, PD169316 (10 μM)-, LY294002 (10 μM)-, AZD5363 (2 μM)-, everolimus (10 nM)-, LY364947 (10 μM)-, ciclosporin A (CsA, 1 μM)-, T-5224 (10 μM)-, and Bay11-7082 (10 μM)-treated THP-1-derived M2 macrophages for 24 h. Relative mRNA expression in the vehicle control is expressed as 1.0 (n = 4 for each). (B,C,E,F): Quantitative detection of IL-10 (B,C) and/or IL-8 (E,F) secretion by an ELISA assay in SCH772964 (B,E)- and SP600125 (C,F)-treated THP-1-derived M2 macrophages. Relative cytokine secretion in the vehicle control is expressed as 1.0 (n = 4 for each). **: p < 0.01 vs. the vehicle control.
Figure 7
Figure 7
Protein expression levels of phosphorylated ERK1/2 (P-ERK1/2) and P-JNK in THP-1-derived M2 macrophages following the SKA-121 treatment and high [K+]e exposure. AD: Western blot showing P-ERK1/2, total ERK1/2 (ERK1/2) (A,B), P-JNK, and total JNK (JNK) (C,D) in 1 μM SKA-121-treated (A,C) and high [K+]e-exposed (B,D) THP-1-derived M2 macrophages. Specific band signals were observed at 42 (P-ERK2), 42 (ERK2), 43/50 (P-JNK), and 43/50 (JNK) kDa. EH: Summarized results of the relative protein expression of P-ERK2/ERK2 (E,F) and P-JNK/JNK (G,H) in 1 μM SKA-121-treated (E,G) and high [K+]e-exposed (F,H) THP-1-derived M2 macrophages. After compensation with the optical density of the ACTB signal (43 kDa), the expression level in the vehicle control or 5 mM K+ is expressed as 1.0 (n = 4 for each). **: p < 0.01 vs. the vehicle control and 5 mM K+.
Figure 8
Figure 8
Protein expression levels of phosphorylated c-Jun (P-c-Jun) following the SKA-121 treatment and high [K+]e exposure in THP-1-derived M2 macrophages. (A,B): Western blot showing P-c-Jun, and unphosphorylated c-Jun (c-Jun) in 1 μM SKA-121-treated (A) and high [K+]e-exposed (B) THP-1-derived M2 macrophages. Specific band signals were observed at 42-46 (P-c-Jun) and 40 (c-Jun) kDa. (C,D): Summarized results of the relative protein expression of P-c-Jun/c-Jun in 1 μM SKA-121-treated (C) and high [K+]e-exposed (D) THP-1-derived M2 macrophages. After compensation with the optical density of the ACTB signal (43 kDa), the expression level in the vehicle control is expressed as 1.0 (n = 4 for each). **: p < 0.01 vs. the vehicle control and 5 mM K+.
Figure 9
Figure 9
Effects of treatment with a CREB inhibitor on expression levels of IL-10, IL-8, VEGF-A, and TGF-β1 transcripts and on phosphorylated P-CREB protein levels following the SKA-121 treatment and high [K+]e exposure in THP-1-derived M2 macrophages. (AD): Real-time PCR examination of IL-10 (A), IL-8 (B), VEGF-A (C), and TGF-β1 (D) expression in THP-1-derived M2 macrophages treated with vehicle and 1 μM 666-15 for 24 h. Relative mRNA expression in the vehicle control is expressed as 1.0 (n = 4 for each). E-F: Western blot showing P-CREB and total CREB (CREB) in 1 μM SKA-121-treated (E) and high [K+]e-exposed (F) THP-1-derived M2 macrophages. Specific band signals for P-CREB and CREB were observed at approximately 40 kDa. G, H: Summarized results of the relative protein expression of P-CREB/CREB in 1 μM SKA-121-treated (G) and high [K+]e-exposed (H) THP-1-derived M2 macrophages. After compensation with the optical density of the ACTB signal, the expression level in the vehicle control or 5 mM K+ is expressed as 1.0 (n = 4 for each). **: p < 0.01 vs. the vehicle control or 5 mM K+.
Figure 10
Figure 10
Effects of treatment with SKA-121 on expression levels of IL-10, IL-8, VEGF-A, and TGF-β1 transcripts and IL-10 and IL-8 secretion in human prostate cancer PC-3 cell-cultured medium-treated THP-1-derived M2 macrophages. (AD): Real-time PCR examination of IL-10 (A), IL-8 (B), VEGF-A (C), and TGF-β1 (D) expression in PC-3 media-treated THP-1-derived M2 macrophages treated (+) or untreated (−) with 1 or 10 μM SKA-121 for 24 h. Relative mRNA expression in the group untreated with PC-3 medium is expressed as 1.0 (n = 4 for each). (E,F): Quantitative detection of IL-10 (E) and IL-8 (F) secretion by an ELISA assay in THP-1-derived M2 macrophages treated or untreated with SKA-121. Relative secretion in the group untreated with PC-3 medium is expressed as 1.0 (n = 4 for each). **: p < 0.01 vs. the vehicle control (−/−).

Similar articles

Cited by

References

    1. Boutilier A.J., Elsawa S.F. Macrphage polarization states in the tumor microenvironment. Int. J. Mol. Sci. 2021;22:6995. doi: 10.3390/ijms22136995. - DOI - PMC - PubMed
    1. Lin Y., Xu J., Lan H. Tumor-associted macrophages in tumor metastasis: Biological roles and clinical therapeutic applications. J. Hematol. Oncol. 2019;12:76. doi: 10.1186/s13045-019-0760-3. - DOI - PMC - PubMed
    1. Genin M., Clement F., Fattaccioli A., Raes M., Michiels C. M1 and M2 macrophages derived from THP-1 cells differentially modulate the response of cancer cells to etoposide. BMC Cancer. 2010;15:577. doi: 10.1186/s12885-015-1546-9. - DOI - PMC - PubMed
    1. Salmaninejad A., Valilou S.F., Soltani A., Ahmadi S., Abarghan Y.J., Rosengren R.J., Sahebkar A. Tumor-associated macrophages: Role in cancer development and therapeutic implications. Cell. Oncol. 2019;42:591–608. doi: 10.1007/s13402-019-00453-z. - DOI - PubMed
    1. Vaeth M., Feske S. Ion channelopathies of the immune system. Curr. Opin. Immunol. 2018;52:39–50. doi: 10.1016/j.coi.2018.03.021. - DOI - PMC - PubMed

MeSH terms

Substances