. 2022 Aug 3;23(15):8620.
doi: 10.3390/ijms23158620.

Screening and Verification of Photosynthesis and Chloroplast-Related Genes in Mulberry by Comparative RNA-Seq and Virus-Induced Gene Silencing

Affiliations

Screening and Verification of Photosynthesis and Chloroplast-Related Genes in Mulberry by Comparative RNA-Seq and Virus-Induced Gene Silencing

Yong Li et al. Int J Mol Sci. .

Abstract

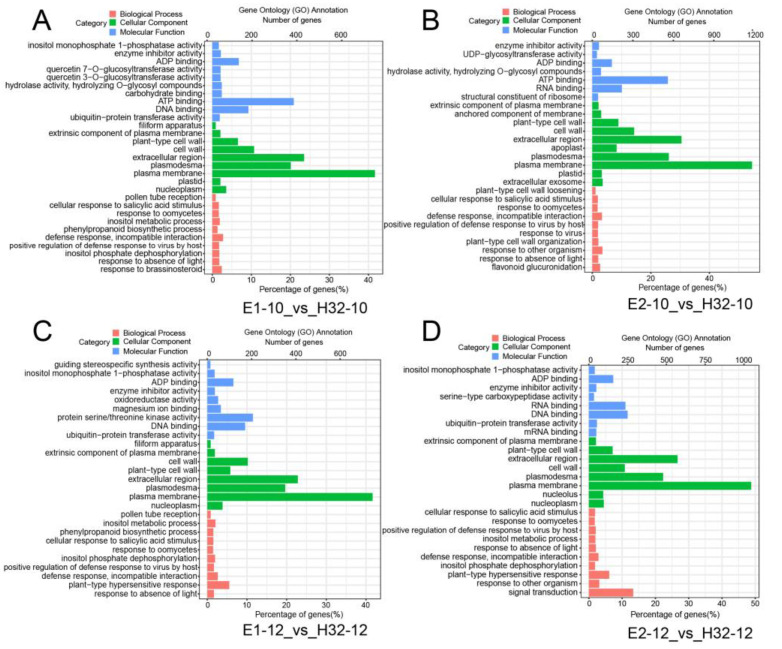
Photosynthesis is one of the most important factors in mulberry growth and production. To study the photosynthetic regulatory network of mulberry we sequenced the transcriptomes of two high-yielding (E1 and E2) and one low-yielding (H32) mulberry genotypes at two-time points (10:00 and 12:00). Re-annotation of the mulberry genome based on the transcriptome sequencing data identified 22,664 high-quality protein-coding genes with a BUSCO-assessed completeness of 93.4%. A total of 6587 differentially expressed genes (DEGs) were obtained in the transcriptome analysis. Functional annotation and enrichment revealed 142 out of 6587 genes involved in the photosynthetic pathway and chloroplast development. Moreover, 3 out of 142 genes were further examined using the VIGS technique; the leaves of MaCLA1- and MaTHIC-silenced plants were markedly yellowed or even white, and the leaves of MaPKP2-silenced plants showed a wrinkled appearance. The expression levels of the ensiled plants were reduced, and the levels of chlorophyll b and total chlorophyll were lower than those of the control plants. Co-expression analysis showed that MaCLA1 was co-expressed with CHUP1 and YSL3; MaTHIC was co-expressed with MaHSP70, MaFLN1, and MaEMB2794; MaPKP2 was mainly co-expressed with GH9B7, GH3.1, and EDA9. Protein interaction network prediction revealed that MaCLA1 was associated with RPE, TRA2, GPS1, and DXR proteins; MaTHIC was associated with TH1, PUR5, BIO2, and THI1; MaPKP2 was associated with ENOC, LOS2, and PGI1. This study offers a useful resource for further investigation of the molecular mechanisms involved in mulberry photosynthesis and preliminary insight into the regulatory network of photosynthesis.

Keywords: VIGS; mulberry; photosynthesis regulation; re-annotation; transcriptomes.


Conflict of interest statement

The authors declare no conflict of interest.

Figures

Figure 1
Figure 1
Volcano map of DEGs. (A) Volcano map of DEGs in E1-10_vs_H32-10; (B) Volcano map of DEGs in E1-12_vs_H32-12; (C) Volcano map of DEGs in E2-10_vs_H32-10; (D) Volcano map of DEGs in E2-12_vs_H32-12; The red, blue, and gray dots represent up-regulated DEGs (Up), down-regulated DEGs (Down), and not change genes (Not), respectively.
Figure 2
Figure 2
Venn diagram of DEGs. (A) Venn diagram of DEGs in different cultivars (B) Venn diagram of DEGs between 10:00 and 12:00.
Figure 3
Figure 3
Gene ontology (GO) analysis of DEGs. (A) GO map of DEGs in E1-10_vs_H32-10; (B) GO map of DEGs in E1-12_vs_H32-12; (C) GO map of DEGs in E2-10_vs_H32-10; (D) GO map of DEGs in E2-12_vs_H32-12; y-axis represents the GO classification, the bottom and top of the x-axis represent the percentage and number of genes, respectively.
Figure 4
Figure 4
KEGG (Kyoto Encyclopedia of Genes and Genomes Pathway) analysis of DEGs. (A) GO map of DEGs in E1-10_vs_H32-10; (B) GO map of DEGs in E1-12_vs_H32-12; (C) GO map of DEGs in E2-10_vs_H32-10; (D) GO map of DEGs in E2-12_vs_H32-12. y-axis represents the pathname, and the x-axis represents the enrichment factor. The larger the enrichment factor, the higher the enrichment level of DGEs in the pathway. The p value is expressed by color with white as the border. The deeper the red color, the more important the accumulation of DEGs in the signaling pathway. The number of DEGs in a pathway was expressed by the size of the circle. The larger the circle, the higher the enrichment of the pathway.
Figure 5
Figure 5
Virus-induced gene silencing (VIGS) of MaCLA1, MaTHIC, and MaPKP2 in mulberry. (A) pTRV2 (EV) plant as negative control; (B) VIGS plant of MaPDS as positive control; (C) The stem of the enlarged map for the red box in (B,D) VIGS plant of MaCLA1; (E) MaTHIC VIGS plant; (F) VIGS plant of MaPKP2; (G) leaf phenotype of VIGS plant; Scale bar, 1 cm. (H) Relative expression of MaCLA1, MaTHIC, and MaPKP2; (I) Chlorophyll contents of the chlorotic leaves from VIGS plants. Error bars indicate the standard deviation (n = 2). Chla: chlorophyll a, Chlb: chlorophyll b, Chlt: total chlorophyll.
Figure 6
Figure 6
Co-expression genes of MaCLA1, MaPKP2, and MaTHIC. (A) Co-expression genes of MaCLA1; (B) Co-expression genes of MaPKP2, (C) Co-expression genes of MaTHIC.

Similar articles

Cited by

References

    1. Li R., Hu F., Li B., Zhang Y., Chen M., Fan T., Wang T. Whole genome bisulfite sequencing methylome analysis of mulberry (Morus alba) reveals epigenome modifications in response to drought stress. Sci. Rep. 2020;10:8013. doi: 10.1038/s41598-020-64975-5. - DOI - PMC - PubMed
    1. Gan T., Lin Z., Bao L., Hui T., Cui X., Huang Y., Wang H., Su C., Jiao F., Zhang M., et al. Comparative Proteomic Analysis of Tolerant and Sensitive Varieties Reveals That Phenylpropanoid Biosynthesis Contributes to Salt Tolerance in Mulberry. Int. J. Mol. Sci. 2021;22:9402. doi: 10.3390/ijms22179402. - DOI - PMC - PubMed
    1. Guo Z., Zeng P., Xiao X., Peng C. Physiological, anatomical, and transcriptional responses of mulberry (Morus alba L.) to Cd stress in contaminated soil. Environ. Pollut. 2021;284:117387. doi: 10.1016/j.envpol.2021.117387. - DOI - PubMed
    1. Zeng P., Guo Z., Xiao X., Peng C., Liu L., Yan D., He Y. Physiological stress responses, mineral element uptake and phytoremediation potential of Morus alba L. in cadmium-contaminated soil. Ecotoxicol. Env. Saf. 2020;189:109973. doi: 10.1016/j.ecoenv.2019.109973. - DOI - PubMed
    1. Zafar Z., Rasheed F., Ul Haq A., Ibrahim F.H., Afzal S., Nazre M., Akram S., Hussain Z., Kudus K.A., Mohsin M., et al. Interspecific Differences in Physiological and Biochemical Traits Drive the Water Stress Tolerance in Young Morus alba L. and Conocarpus erectus L. Saplings. Plants. 2021;10:1615. doi: 10.3390/plants10081615. - DOI - PMC - PubMed

LinkOut - more resources