. 2022 Aug 4;23(15):8654.
doi: 10.3390/ijms23158654.

Harnessing the Power of Purple Sweet Potato Color and Myo-Inositol to Treat Classic Galactosemia

Affiliations

Harnessing the Power of Purple Sweet Potato Color and Myo-Inositol to Treat Classic Galactosemia

Synneva Hagen-Lillevik et al. Int J Mol Sci. .

Abstract

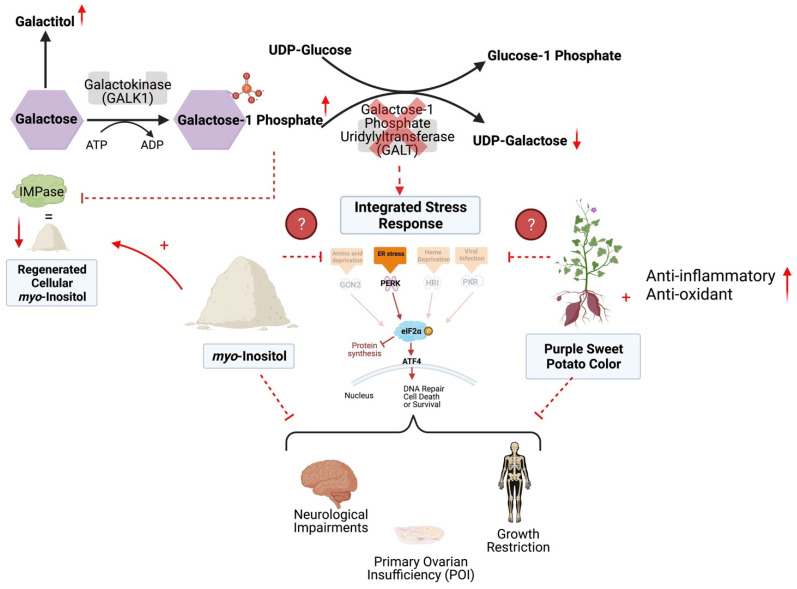
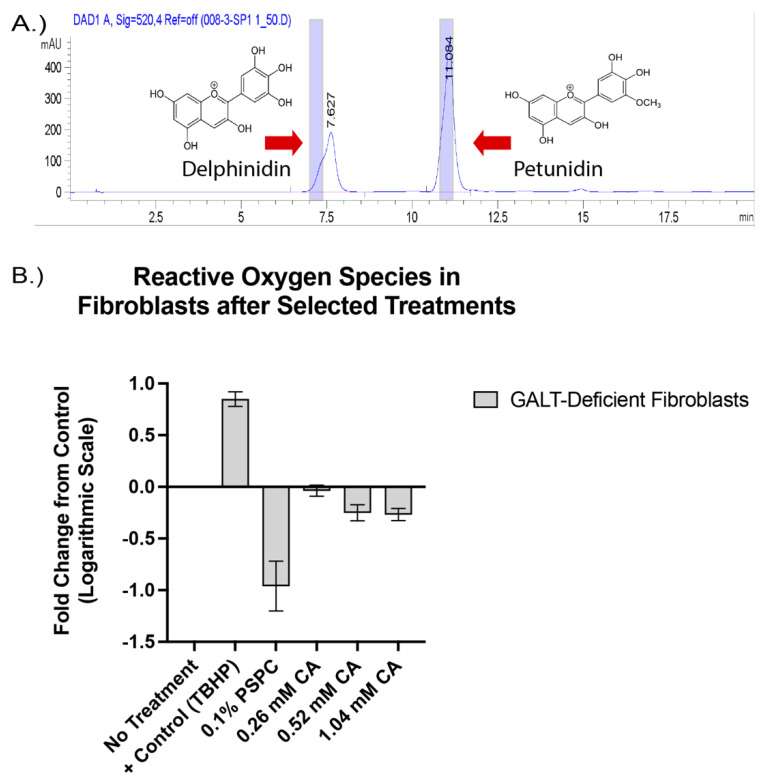
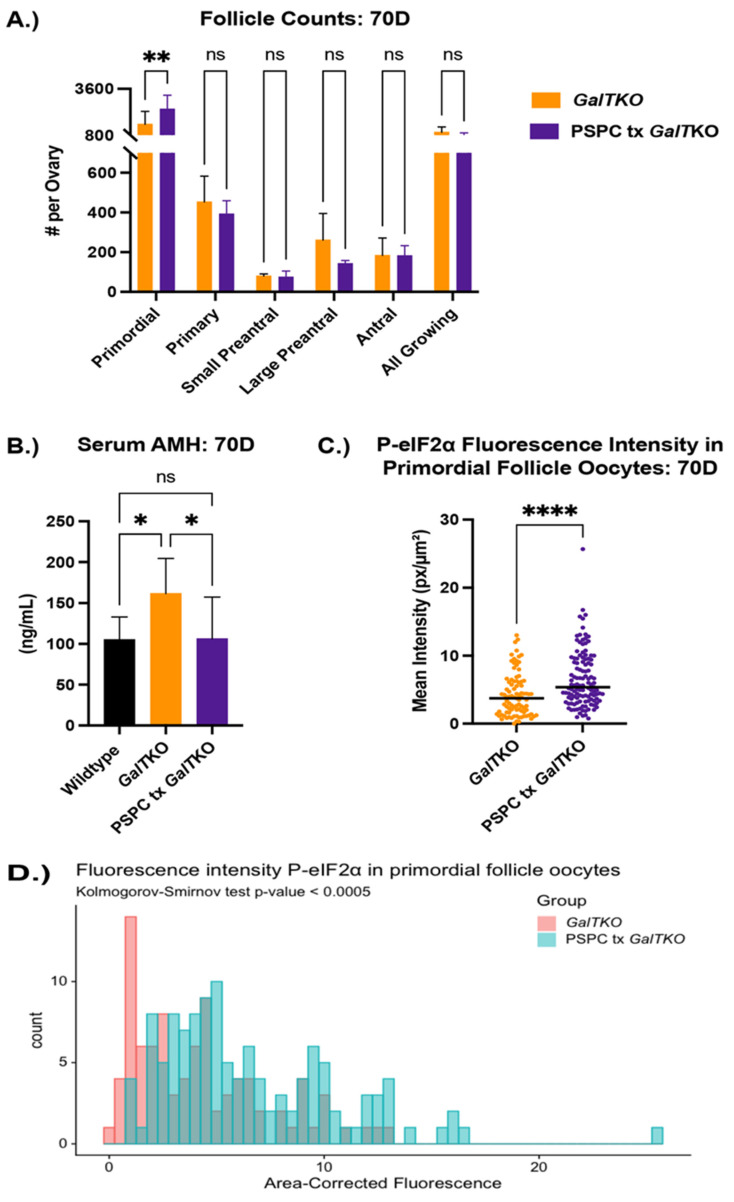
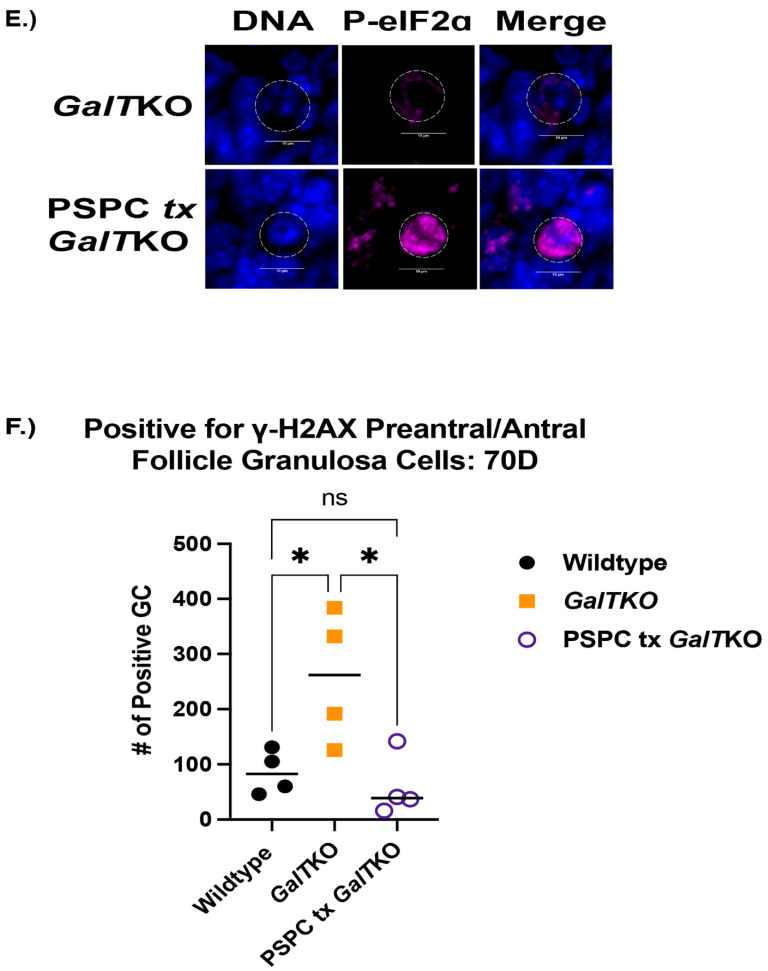
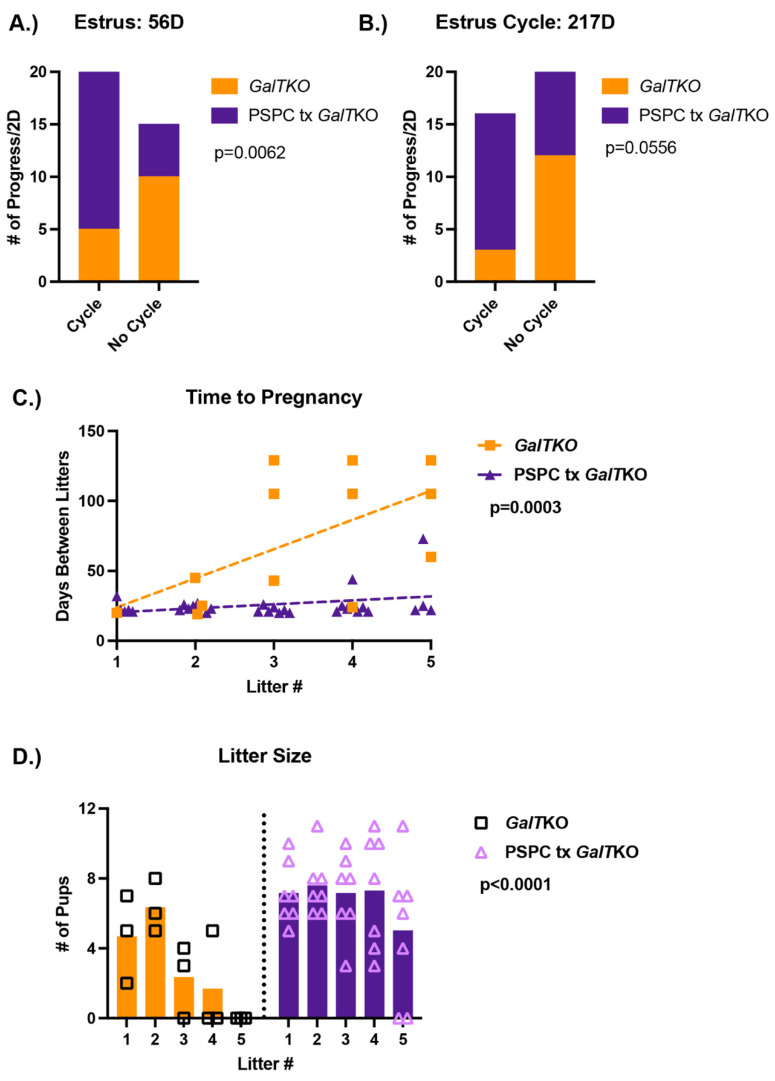
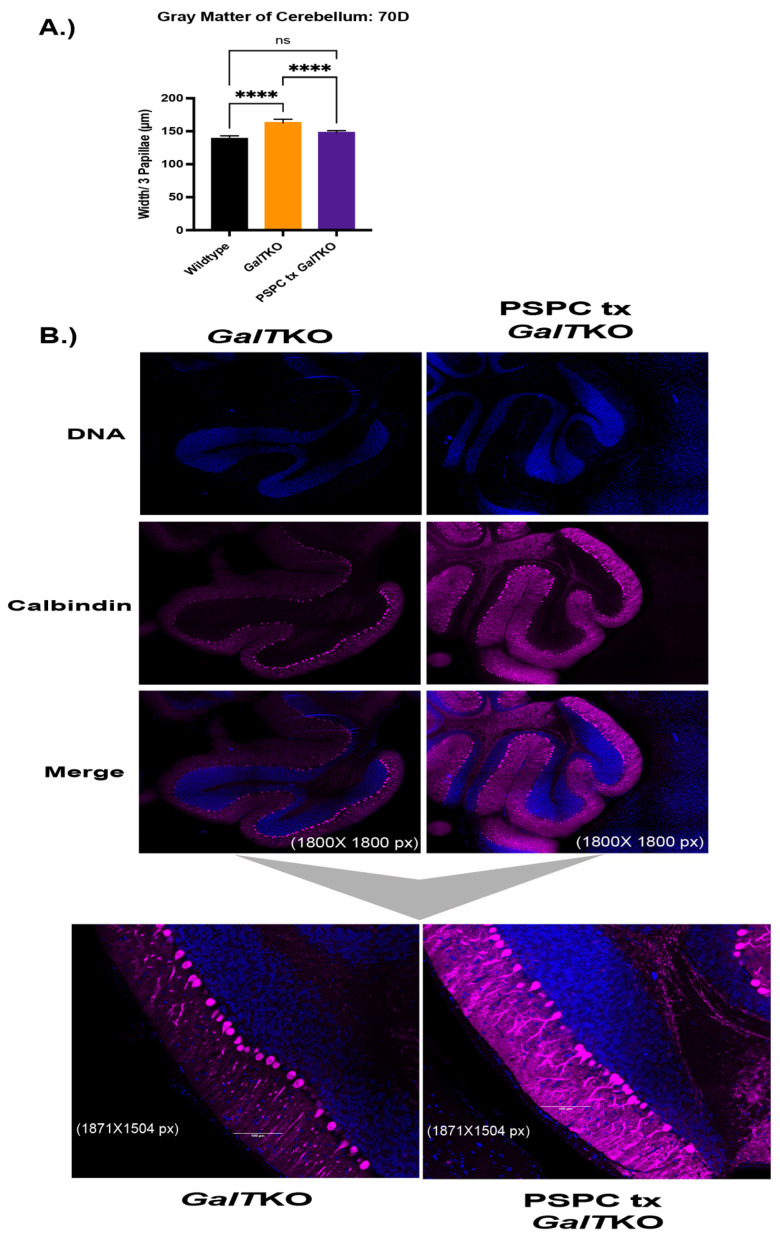
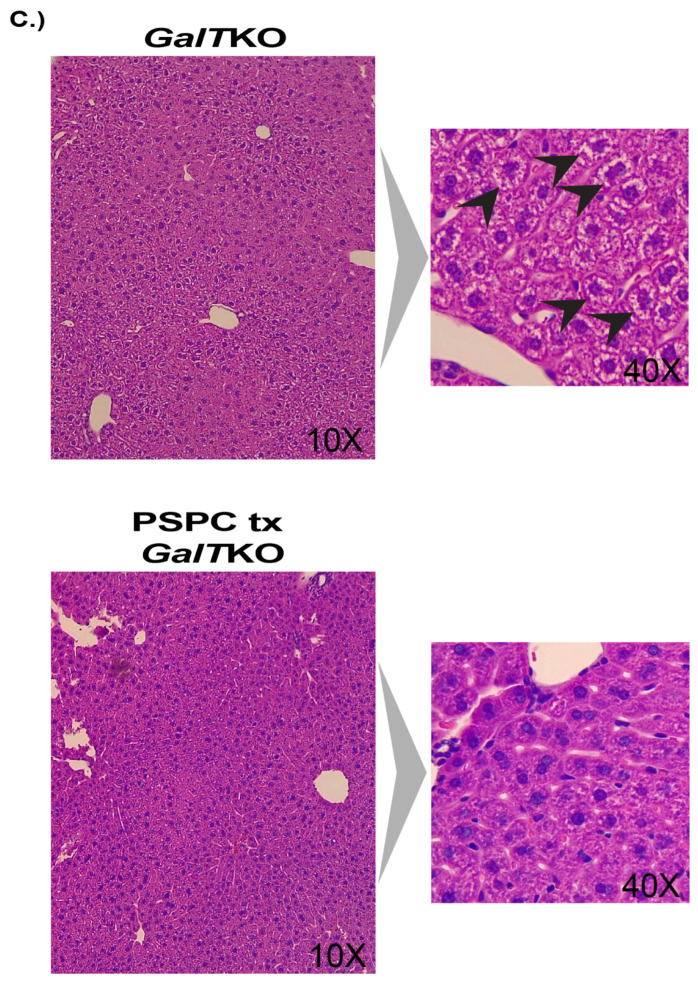
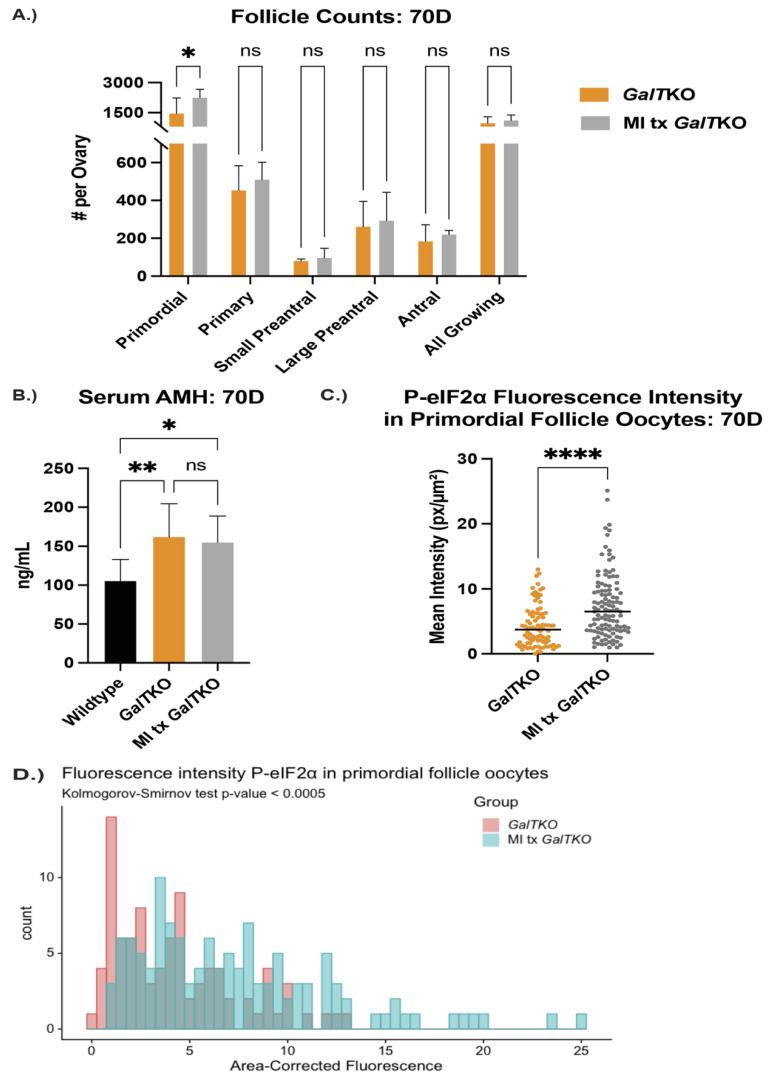
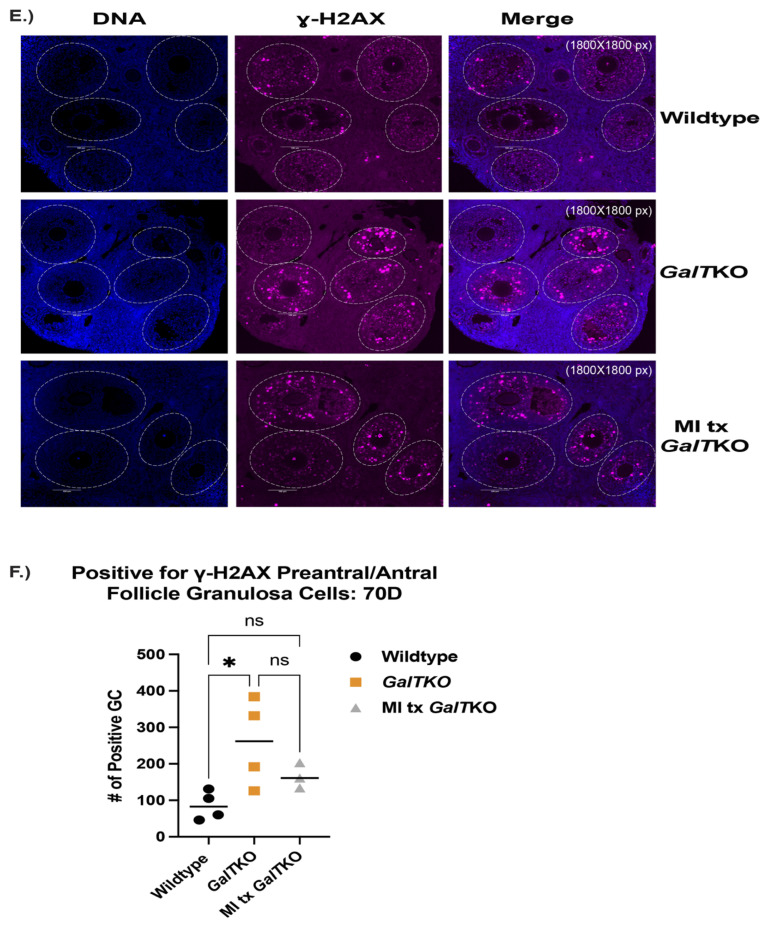
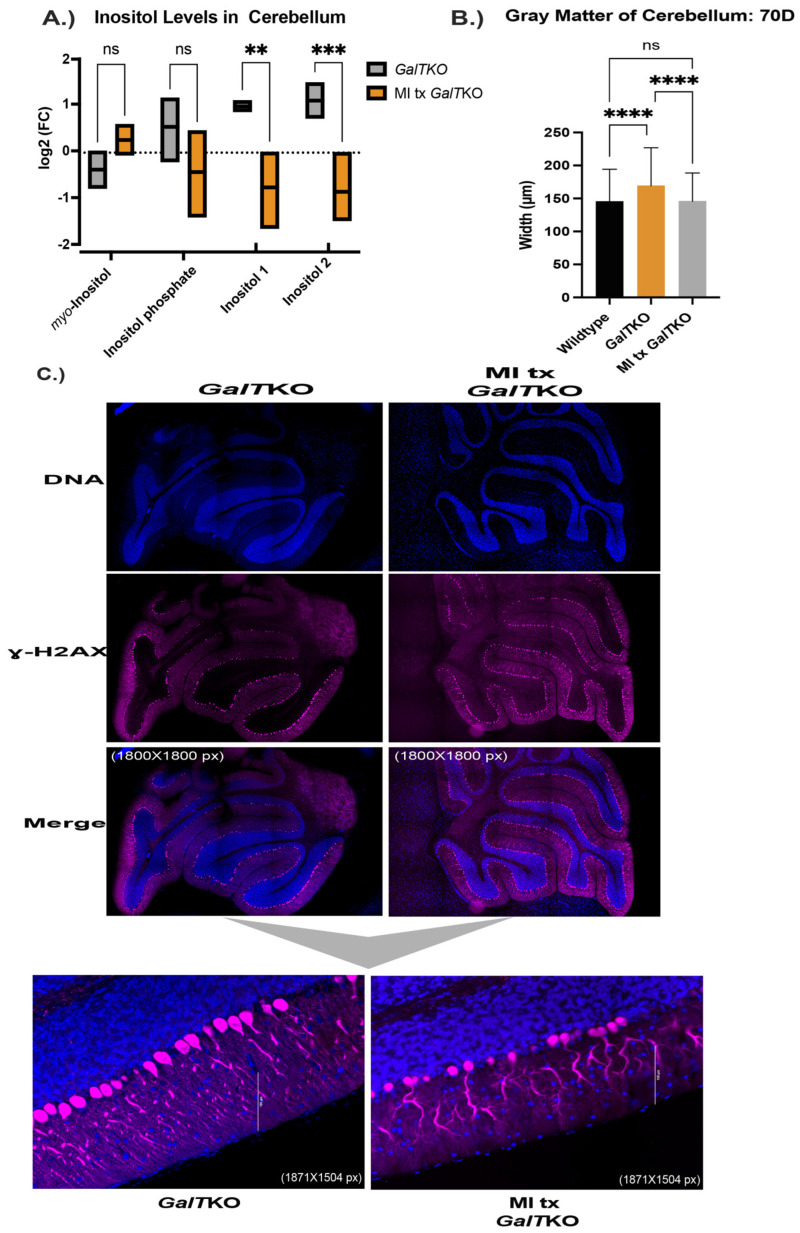
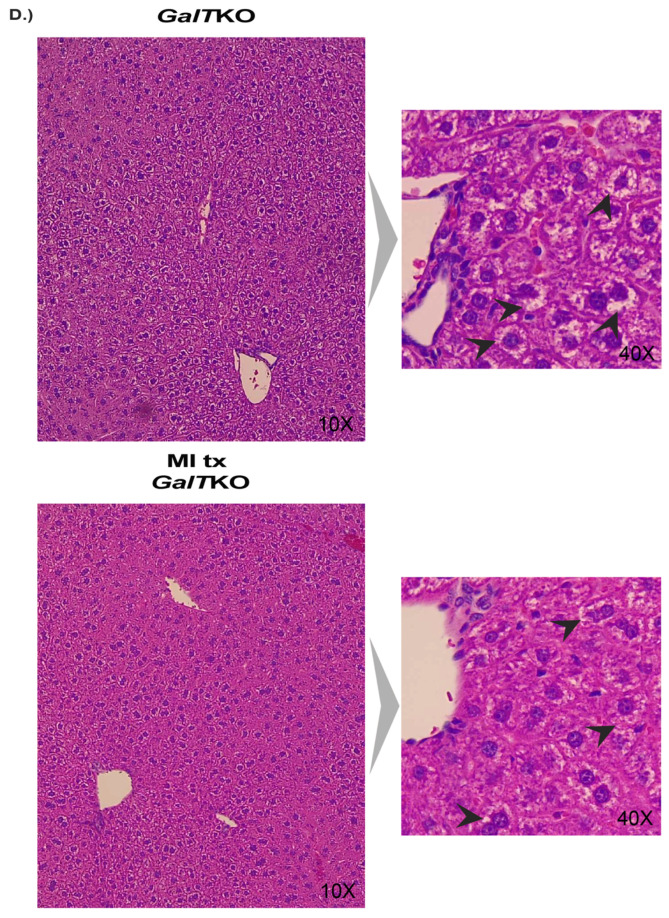
Classic Galactosemia (CG) is a devastating inborn error of the metabolism caused by mutations in the GALT gene encoding the enzyme galactose-1 phosphate uridylyltransferase in galactose metabolism. Severe complications of CG include neurological impairments, growth restriction, cognitive delays, and, for most females, primary ovarian insufficiency. The absence of the GALT enzyme leads to an accumulation of aberrant galactose metabolites, which are assumed to be responsible for the sequelae. There is no treatment besides the restriction of dietary galactose, which does not halt the development of the complications; thus, additional treatments are sorely needed. Supplements have been used in other inborn errors of metabolism but are not part of the therapeutic regimen for CG. The goal of this study was to test two generally recognized as safe supplements (purple sweet potato color (PSPC) and myo-inositol (MI)) that may impact cellular pathways contributing to the complications in CG. Our group uses a GalT gene-trapped mouse model to study the pathophysiology in CG, which phenocopy many of the complications. Here we report the ability of PSPC to ameliorate dysregulation in the ovary, brain, and liver of our mutant mice as well as positive results of MI supplementation in the ovary and brain.

Keywords: Classic Galactosemia; Integrated Stress Response; antioxidant; cerebellum; eukaryotic initiation Factor 2 alpha (eIF2ɑ); hepatocyte balloon-cell change; myo-inositol; primary ovarian insufficiency; purple sweet potato color; supplements.


Conflict of interest statement

The authors declare no conflict of interest.

Figures

Figure 1
Figure 1
The Leloir pathway of galactose metabolism and proposed mechanism of myo-inositol (MI) and purple sweet potato color (PSPC) support in Classic Galactosemia. With the deficiency of GALT, galactose-1 phosphate and galactitol are present with a deficiency of UDP-galactose. This contributes to a dysregulated Integrated Stress Response (ISR), cellular stress, and DNA damage. PSPC has the potential to relieve cellular distress by bolstering the antioxidant defense, scavenging free radicals, reducing ER stress, and thus supporting the ISR; additional anti-inflammatory and antioxidant pathways are likely involved. Supplemental MI may ameliorate cellular distress by restoring levels of inositol and reducing ER stress. Supplementation of either may improve the sequelae of Classic Galactosemia. Solid arrows and inhibitor lines represent known metabolic processes; dashed red lines represent potentially inhibited metabolic processes; small solid red arrows indicate the increases or decreases of selected metabolites in the pathway. Finally, question marks with dashed lines indicate that the mechanism of the two selected supplement’s impacts on the ISR are unknown. This figure was created in BioRender.com.
Figure 2
Figure 2
The presence of anthocyanidin compounds and bioactive properties of the purple sweet potato color (PSPC). Peak values of present anthocyanidin backbones are shown in (A), with blue shaded regions indicating the standard peaks. Fold change in reactive oxygen species compared to untreated GalTKO fibroblasts (B). Bars represent standard deviation in replicates. Positive control (TBHP), 0.1% PSPC, and increasing concentrations of citric acid (0.26 mM, 0.52 mM, and 1.04 mM) to account for the citric acid present in the PSPC extract.
Figure 3
Figure 3
Impact of PSPC supplementation on the ovary. Follicle counts (A) at 70D between untreated GalTKO and PSPC supplemented GalTKO mice. Serum AMH compared between WT, GalTKO, and PSPC treated GalTKO mice (B). Median fluorescence intensity of P-eIF2ɑ (C) in primordial follicle oocytes. The distribution of primordial follicle oocytes is shown in (D). Representative image of primordial oocytes stained for P-eIF2ɑ, with white dashed circles showing outline of oocyte (E). The number of secondary follicle granulosa cells stained positive for ɣ-H2AX between WT and the two GalTKO groups (F). Data were analyzed with one- or two-way ANOVA, MWU test, or KS test. * p ≤ 0.05, ** p ≤ 0.01, **** p ≤ 0.0001.
Figure 3
Figure 3
Impact of PSPC supplementation on the ovary. Follicle counts (A) at 70D between untreated GalTKO and PSPC supplemented GalTKO mice. Serum AMH compared between WT, GalTKO, and PSPC treated GalTKO mice (B). Median fluorescence intensity of P-eIF2ɑ (C) in primordial follicle oocytes. The distribution of primordial follicle oocytes is shown in (D). Representative image of primordial oocytes stained for P-eIF2ɑ, with white dashed circles showing outline of oocyte (E). The number of secondary follicle granulosa cells stained positive for ɣ-H2AX between WT and the two GalTKO groups (F). Data were analyzed with one- or two-way ANOVA, MWU test, or KS test. * p ≤ 0.05, ** p ≤ 0.01, **** p ≤ 0.0001.
Figure 4
Figure 4
Results of the breeding trial following PSPC supplementation. Estrus cycles before pairing with a male (A) and following the completion of the breeding trial (B) (p-value shown from Fisher’s exact test). The number of days between litters (time to pregnancy) over five litters (C); p-value represents the difference in slope between the two groups (simple linear regression). The number of pups or litter size for untreated GalTKO pairs and PSPC treated GalTKO pairs over five litters (D) (p-value for two-way ANOVA).
Figure 5
Figure 5
Gray matter widths, dendritic arborization, and liver histology after PSPC supplementation. (A) Shows gray matter thickness of treated mice compared to wildtype and untreated GalTKO mice. In (B), the first six panels are show at 1800 × 1800 pixel magnification with bottom subfigures at 1871 × 1504 pixel magnification. (C) Panels on the left show H&E-stained liver histology at 10× and 40× in the subfigure (C). Black arrows depict balloon-cell change areas in hepatocyte cytoplasm. **** p ≤ 0.0001.
Figure 5
Figure 5
Gray matter widths, dendritic arborization, and liver histology after PSPC supplementation. (A) Shows gray matter thickness of treated mice compared to wildtype and untreated GalTKO mice. In (B), the first six panels are show at 1800 × 1800 pixel magnification with bottom subfigures at 1871 × 1504 pixel magnification. (C) Panels on the left show H&E-stained liver histology at 10× and 40× in the subfigure (C). Black arrows depict balloon-cell change areas in hepatocyte cytoplasm. **** p ≤ 0.0001.
Figure 6
Figure 6
The effects of myo-inositol (MI) supplementation on the ovary. Follicle counts (A) comparing untreated GalTKO mice to MI supplemented GalTKO mice at 70D using two-way ANOVA. (B) Levels of serum AMH between WT and either untreated or MI supplemented GalTKO mice (one-way ANOVA). Median fluorescence intensity of P-eIF2ɑ in primordial oocytes is shown in (C), while the distribution of primordial oocyte staining intensity is depicted in (D) (KS test). A representative image of ɣ-H2AX staining in secondary follicle granulosa cells (E) and the number of secondary granulosa cells staining positive for ɣ-H2AX (F). White dashed circles denote secondary follicle boundaries. * p ≤ 0.05, ** p ≤ 0.01, **** p ≤ 0.0001.
Figure 6
Figure 6
The effects of myo-inositol (MI) supplementation on the ovary. Follicle counts (A) comparing untreated GalTKO mice to MI supplemented GalTKO mice at 70D using two-way ANOVA. (B) Levels of serum AMH between WT and either untreated or MI supplemented GalTKO mice (one-way ANOVA). Median fluorescence intensity of P-eIF2ɑ in primordial oocytes is shown in (C), while the distribution of primordial oocyte staining intensity is depicted in (D) (KS test). A representative image of ɣ-H2AX staining in secondary follicle granulosa cells (E) and the number of secondary granulosa cells staining positive for ɣ-H2AX (F). White dashed circles denote secondary follicle boundaries. * p ≤ 0.05, ** p ≤ 0.01, **** p ≤ 0.0001.
Figure 7
Figure 7
Characterization of MI supplementation in the brain and liver of GalTKO mice. Box and violin plot with line at the mean depicting measured inositol compounds between untreated GalTKO and MI treated GalTKO mice in the cerebellum (A). Gray matter, or combined widths of the molecular and granular layers in the brain, between WT, GalTKO, and MI treated GalTKO mice (B). Representative images of untreated and MI supplemented GalTKO cerebellum, immunostained for calbindin (C). The first six panels in (C) show the cerebellum at 1800 × 1800 pixels with subfigures at a magnification of 1857 × 1504 pixels. (D) H&E-stained liver histology with the larger panels at 10× and subfigures at 40×. Black arrows depict areas in the cytoplasm of hepatocytes with balloon-cell change. ** p ≤ 0.01, *** p ≤ 0.001, **** p ≤ 0.0001.
Figure 7
Figure 7
Characterization of MI supplementation in the brain and liver of GalTKO mice. Box and violin plot with line at the mean depicting measured inositol compounds between untreated GalTKO and MI treated GalTKO mice in the cerebellum (A). Gray matter, or combined widths of the molecular and granular layers in the brain, between WT, GalTKO, and MI treated GalTKO mice (B). Representative images of untreated and MI supplemented GalTKO cerebellum, immunostained for calbindin (C). The first six panels in (C) show the cerebellum at 1800 × 1800 pixels with subfigures at a magnification of 1857 × 1504 pixels. (D) H&E-stained liver histology with the larger panels at 10× and subfigures at 40×. Black arrows depict areas in the cytoplasm of hepatocytes with balloon-cell change. ** p ≤ 0.01, *** p ≤ 0.001, **** p ≤ 0.0001.

Similar articles

Cited by

References

    1. Lai K., Langley S.D., Khwaja F.W., Schmitt E.W., Elsas L.J. GALT deficiency causes UDP-hexose deficit in human galactosemic cells. Glycobiology. 2003;13:285–294. doi: 10.1093/glycob/cwg033. - DOI - PubMed
    1. Waggoner D.D., Buist N.R., Donnell G.N. Long-term prognosis in galactosaemia: Results of a survey of 350 cases. J. Inherit. Metab. Dis. 1990;13:802–818. doi: 10.1007/BF01800204. - DOI - PubMed
    1. Berry G.T. Classic Galactosemia and Clinical Variant Galactosemia. In: Adam M.P., Ardinger H.H., Pagon R.A., Wallace S.E., Bean L.J.H., Stephens K., Amemiya A., editors. GeneReviews(®) University of Washington; Seattle, WA, USA: 1993. - PubMed
    1. Kuiper A., Grünewald S., Murphy E., Coenen M.A., Eggink H., Zutt R., Rubio-Gozalbo M.E., Bosch A.M., Williams M., Derks T.G.J., et al. Movement disorders and nonmotor neuropsychological symptoms in children and adults with classical galactosemia. J. Inherit. Metab. Dis. 2019;42:451–458. doi: 10.1002/jimd.12054. - DOI - PubMed
    1. Fridovich-Keil J.L., Gubbels C.S., Spencer J.B., Sanders R.D., Land J.A., Rubio-Gozalbo E. Ovarian function in girls and women with GALT-deficiency galactosemia. J. Inherit. Metab. Dis. 2011;34:357–366. doi: 10.1007/s10545-010-9221-4. - DOI - PMC - PubMed

LinkOut - more resources