. 2022 Aug 4;23(15):8685.
doi: 10.3390/ijms23158685.

Sex-Dependent Regulation of Placental Oleic Acid and Palmitic Acid Metabolism by Maternal Glycemia and Associations with Birthweight

Affiliations

Sex-Dependent Regulation of Placental Oleic Acid and Palmitic Acid Metabolism by Maternal Glycemia and Associations with Birthweight

Oliver C Watkins et al. Int J Mol Sci. .

Abstract

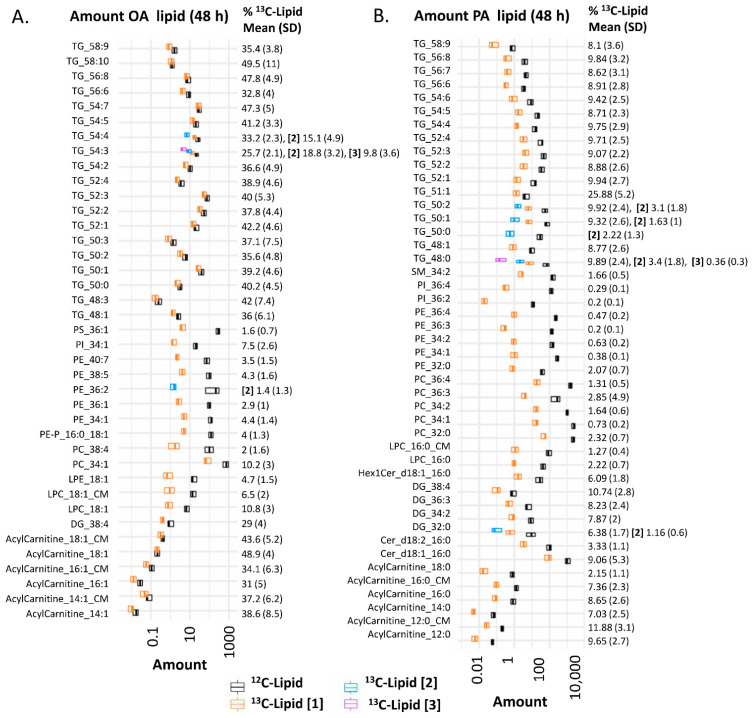
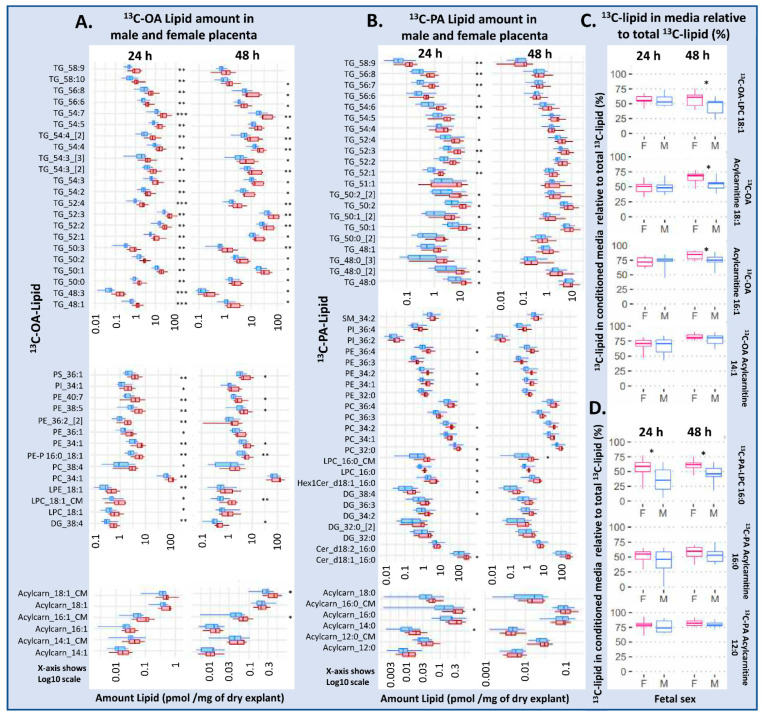
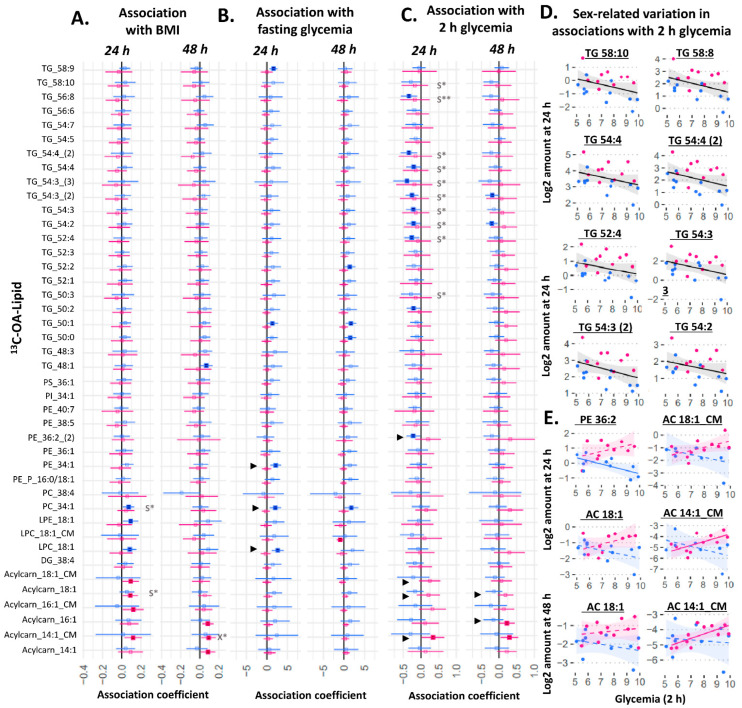
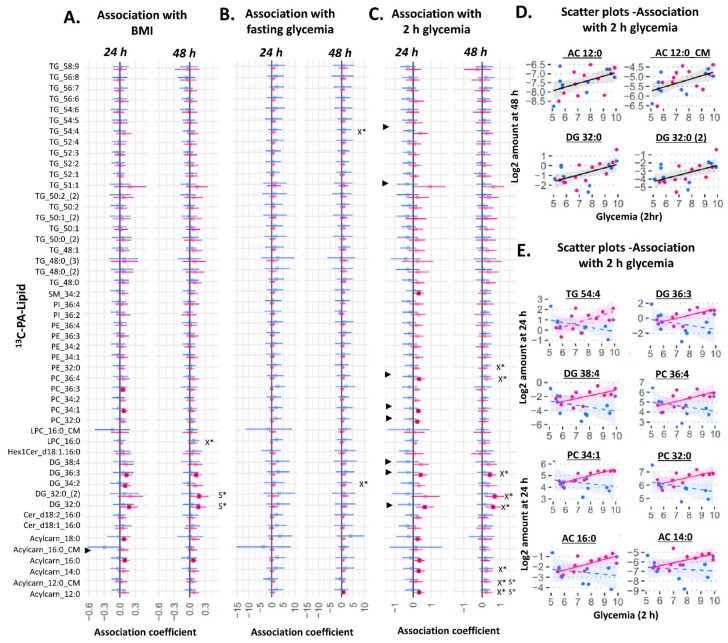
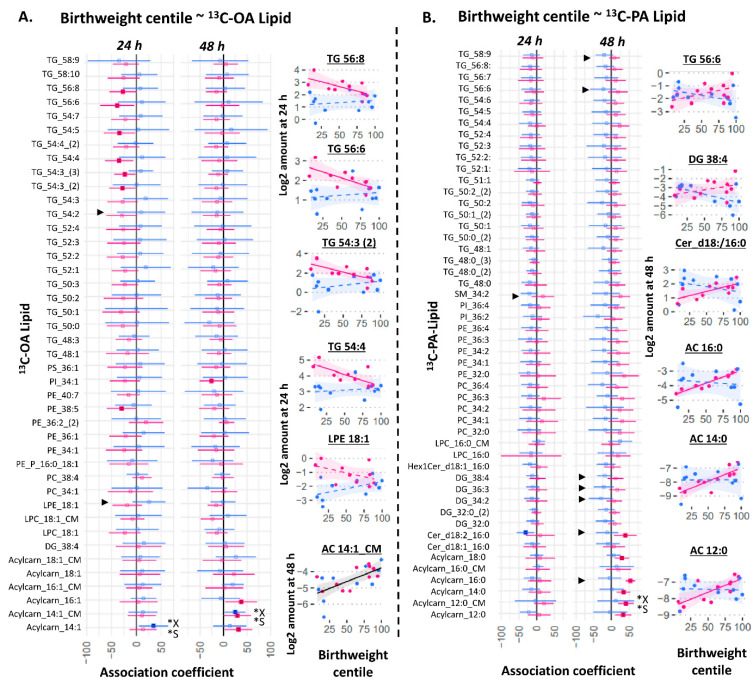
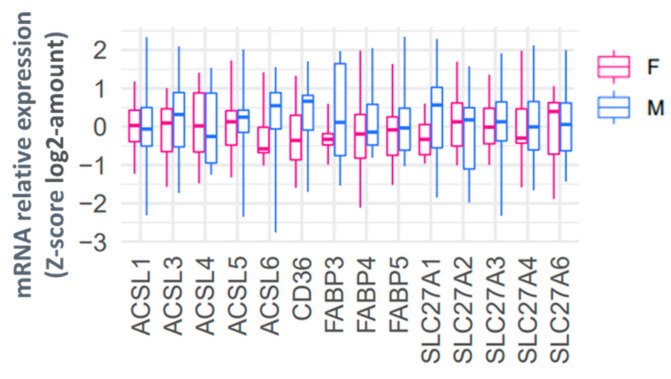
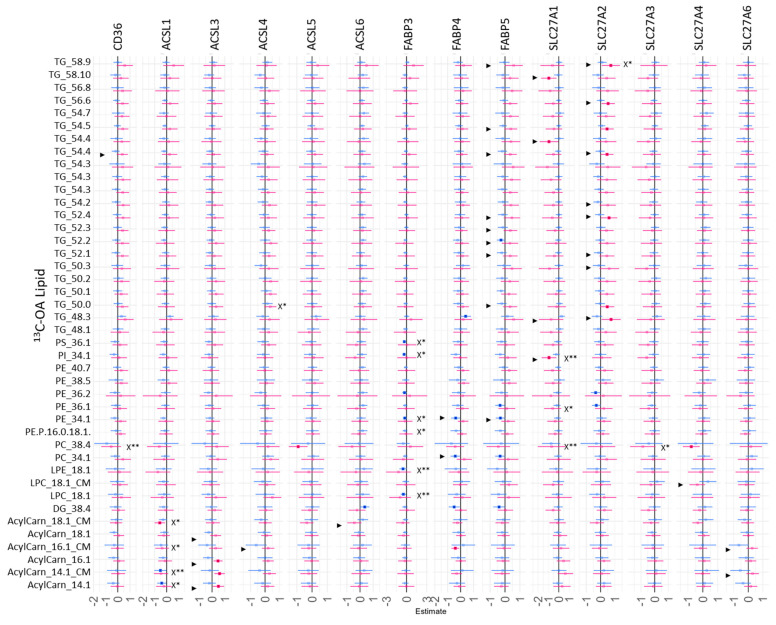
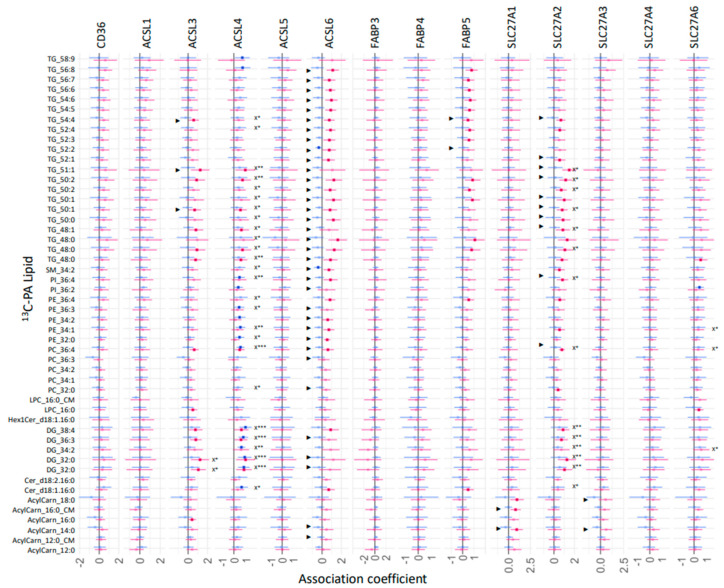
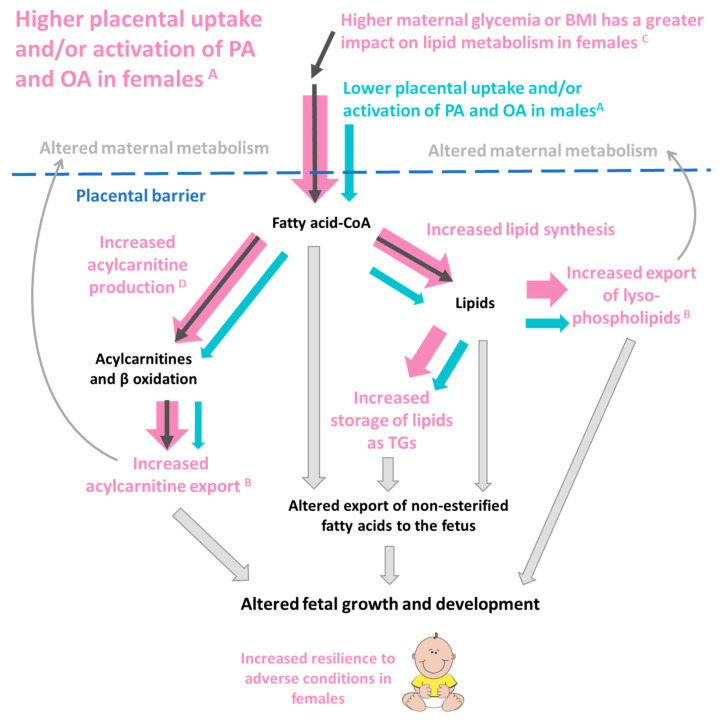
Pregnancy complications such as maternal hyperglycemia increase perinatal mortality and morbidity, but risks are higher in males than in females. We hypothesized that fetal sex-dependent differences in placental palmitic-acid (PA) and oleic-acid (OA) metabolism influence such risks. Placental explants (n = 22) were incubated with isotope-labeled fatty acids (13C-PA or 13C-OA) for 24 or 48 h and the production of forty-seven 13C-PA lipids and thirty-seven 13C-OA lipids quantified by LCMS. Linear regression was used to investigate associations between maternal glycemia, BMI and fetal sex with 13C lipids, and between 13C lipids and birthweight centile. Placental explants from females showed greater incorporation of 13C-OA and 13C-PA into almost all lipids compared to males. Fetal sex also influenced relationships with maternal glycemia, with many 13C-OA and 13C-PA acylcarnitines, 13C-PA-diacylglycerols and 13C-PA phospholipids positively associated with glycemia in females but not in males. In contrast, several 13C-OA triacylglycerols and 13C-OA phospholipids were negatively associated with glycemia in males but not in females. Birthweight centile in females was positively associated with six 13C-PA and three 13C-OA lipids (mainly acylcarnitines) and was negatively associated with eight 13C-OA lipids, while males showed few associations. Fetal sex thus influences placental lipid metabolism and could be a key modulator of the impact of maternal metabolic health on perinatal outcomes, potentially contributing toward sex-specific adaptions in which females prioritize survival.

Keywords: diabetes; fatty acid; fetal growth; fetal sex; lipids; placenta; β-oxidation.


Conflict of interest statement

S.-Y.C. and K.M.G. are part of an academic consortium that has received research funding from Abbott Nutrition, Société Des Produits Nestlé S.A., Danone and BenevolentAI Bio Ltd. for work unrelated to this manuscript. S.-Y.C. and K.M.G. are co-inventors on patent filings by Nestlé S.A., which covers the use of inositol in human health applications, but which do not draw on the work in this manuscript. Godfrey has received reimbursement for speaking at conferences sponsored by companies selling nutritional products. Chan has received reimbursement and honoraria into her research funds from Nestlé S.A. for speaking at a conference. The other authors have no financial or personal conflict of interest to declare.

Figures

Figure 1
Figure 1
Amount of lipid in placental explants (n = 22) incubated in 100 µM 13C-OA (A), or 100 µM 13C-PA (B) for 48 h. Boxplots (median and interquartile range) show the amount (pmol lipid/mg of dry explant) of 13C fatty acid-labeled lipids (orange: mono-labeled [1], light blue: di-labeled, purple: tri-labeled [3]) and endogenous 12C lipids (black) in placental explants and in conditioned media (CM). x-axis is log10 scaled. Numbers to the right show percentage of each lipid labeled with 13C out of the total of that specific lipid (100*Amount 13C lipid/total amount of 13C + 12C of corresponding lipid) alongside standard deviation (SD). Bold square brackets show percentage of each particular lipid di- [2] or tri- [3] labeled with 13C-PA or 13C-OA. Abbreviations; DG: diacylglycerol, Cer: ceramide, Hex: hexose, LPC: lysophosphatidylcholine, LPE: lysophosphatidylethanolamine, OA: oleic acid, PA: palmitic acid, PC: phosphatidylcholine, PE-P: phosphatidylethanolamine-plasmalogen, TG: triacylglycerols.
Figure 2
Figure 2
Differences in amount of lipid in placental explants from males (blue) and females (red) treated with 100 µM 13C-OA (A), or 100 µM 13C-PA (B) for 48 h. (C,D) The percentage of labeled lipid found in media relative to the total amount of the specific 13C lipid in the media and explant, in males and females. Boxes and whiskers represent median, interquartile range and minimum and maximum. X axis is log10 scaled. Statistically significant differences between sexes following Benjamini–Hochberg correction for multiple testing * p < 0.05, ** p < 0.01, *** p < 0.001. Abbreviations, Cer: ceramide, DG: diacylglycerol, Hex1Cer: hexosylceramide, LPC: lysophosphatidylcholine, LPE: lysophosphatidylethanolamine, OA: oleic acid, PA: palmitic acid, PC: phosphatidylcholine, PE-P: phosphatidylethanolamine-plasmalogen, TG: triacylglycerols. F: female, M: male.
Figure 3
Figure 3
Sex-stratified associations between the amount of 13C-OA lipid (outcome) and maternal glycemia or maternal BMI (predictor). X* represents p < 0.05 in linear regression with males and females combined (not shown). S* represents p < 0.05, while S** represents p < 0.01 in linear regression adjusted for sex (not shown). ► represents significant p < 0.05 for the interaction between sex and maternal glycemia on lipid amount. Linear regression was then run separately for males and females. Forest plots (AC) show association coefficient and 95% confidence intervals for males (blue) and females (red) with significance (p < 0.05) shown by dark-colored filled squares. Unadjusted scatter plots illustrating examples of the relationship between 2 h glycemia and amount of lipid for (D) lipids where males and females show similar relationships and for (E) lipids where males and females show different relationships. The Benjamini–Hochberg method was used to correct for multiple testing. Abbreviations: Acylcarn and AC: acylcarnitine, DG: diacylglycerol, LPC: lysophosphatidylcholine, LPE: lysophosphatidylethanolamine, OA: oleic acid, PA: palmitic acid, PC: phosphatidylcholine, PE-P: phosphatidylethanolamine-plasmalogen, TG: triacylglycerols.
Figure 4
Figure 4
Sex-stratified associations between the amount of 13C-PA lipid (outcome) and maternal glycemia or maternal BMI (predictor). X* represents p < 0.05 in linear regression with males and females combined (not shown). S* represents p < 0.05 in linear regression adjusted for sex (not shown). ► represents significant p < 0.05 for the interaction between sex and maternal glycemia on amount of lipid. Linear regression was then run separately for males and females. Forest plots (AC) show association coefficient and 95% confidence intervals for males (blue) and females (red) with significance (p < 0.05) shown by dark-colored filled squares. Unadjusted scatter plots illustrating the relationship between 2 h glycemia and amount of lipid for (D) lipids where males and females show similar relationships and for (E) lipids where males and females show different relationships. The Benjamini–Hochberg method was used to correct for multiple testing. Abbreviations: Acylcarn and AC: Acylcarnitine, DG: diacylglycerol, Cer: ceramide, Hex: hexose, LPC: lysophosphatidylcholine, LPE: lysophosphatidylethanolamine, OA: oleic acid, PA: palmitic acid, PC: phosphatidylcholine, PE-P: phosphatidylethanolamine-plasmalogen, TG: triacylglycerols.
Figure 5
Figure 5
Sex-stratified associations between birthweight centile (outcome) with the amount of placental 13C-OA lipid (A) or 13C-PA lipid (B) after 24 or 48 h of culture. Birthweight centile was standardized for gestational age by local references. X* represents p < 0.05 in linear regression with males and females combined (not shown). S* represents p < 0.05 in linear regression adjusted for sex (not shown). ► represents significant p < 0.05 for the interaction between sex and amount of lipid on birthweight centile. Linear regression was then run separately for males and females (shown in figure). Forest plots (A,B) show association coefficient and 95% confidence intervals for males (blue) and females (red) with significance (p < 0.05) shown by dark-colored filled squares. Unadjusted scatter plots illustrating the relationship between birthweight centile and amount of lipid. The Benjamini–Hochberg method was used to correct for multiple testing. Abbreviations: Acylcarn and AC: Acylcarnitine, DG: diacylglycerol, Cer: ceramide, Hex: hexose, LPC: lysophosphatidylcholine, LPE: lysophosphatidylethanolamine, OA: oleic acid, PA: palmitic acid, PC: phosphatidylcholine, PE-P: phosphatidylethanolamine-plasmalogen, TG: triacylglycerols.
Figure 6
Figure 6
Relative placental mRNA expression of genes involved in fatty acid uptake in females (red) and males (blue). mRNA abundance is normalized to the geometric mean of three housekeeping genes and then log2 transformed and converted to a z-score. Boxes show median and interquartile range while whiskers show minimum and maximum values.
Figure 7
Figure 7
Sex-stratified associations between the amount of 13C-OA lipids (outcome) with relative mRNA abundance after 48 h of culture. Lipid amount was log2 transformed, mRNA abundance was log-2 transformed and z-scored. Linear regression with males and females combined (not shown) with significance p < 0.05 is indicated by X*, whilst significance p < 0.01 is indicated by X**. Interaction between sex*relative mRNA abundance on lipid amount were then investigated with significant interactions p < 0.05 denoted by “►”. Linear regression was then run separately for males and females. Forest plots show association coefficient and 95% confidence intervals for males (blue) and females (red) with significance (p < 0.05 shown by dark-colored filled squares. The Benjamini–Hochberg method was used to correct for multiple testing.
Figure 8
Figure 8
Sex-stratified associations between the amount of 13C-PA lipids (outcome) with relative mRNA abundance after 48 h of culture. Lipid amount was log2 transformed, mRNA abundance was log-2 transformed and z-scored. Linear regression with males and females combined (not shown) with significance p < 0.05 is indicated by X*, whilst significance p < 0.01 or 0.001 is indicated by X** and X***. Interaction between sex and maternal glycemia on lipid amount were then investigated with significant interactions p < 0.05 denoted by “►”. Linear regression was then run separately for males and females. Forest plots show association coefficient and 95% confidence intervals for males (blue) and females (red) with significance (p < 0.05 shown by dark-colored filled circles. The Benjamini–Hochberg method was used to correct for multiple testing.
Figure 9
Figure 9
A postulation of how the sex-dependent placental metabolism of palmitic acid (PA) and oleic acid (OA) may influence offspring outcomes. A Female placenta produce more OA and PA labeled lipids from every measured lipid class, suggesting a greater capacity for fatty acid uptake and activation. B Female placenta also export a higher proportion of lysophospholipids and acylcarnitines compared to males. C In females, but not males, increases in maternal glycemia or BMI are associated with increases in placental PA and OA acylcarnitines and increases in PA lipids generally. In females, increased PA and OA acylcarnitines D are associated with increased birthweight. Thus, increased placental fatty acid uptake and incorporation in females (represented by the fatter pink arrows) could influence placental lipid reservoirs, local placental lipid activity, maternal–fetal lipid transfer and placental signaling to both fetus and mother. Placental lipid processing could influence maternal and fetal metabolism through both direct and indirect lipid-mediated pathways and hence impact fetal development.

Similar articles

Cited by

References

    1. Voldner N., Frey Frøslie K., Godang K., Bollerslev J., Henriksen T. Determinants of birth weight in boys and girls. Hum. Ontogenet. Int. J. Interdiscip. Dev. Res. 2009;3:7–12. doi: 10.1002/huon.200900001. - DOI
    1. Roland M.C.P., Friis C.M., Godang K., Bollerslev J., Haugen G., Henriksen T. Maternal factors associated with fetal growth and birthweight are independent determinants of placental weight and exhibit differential effects by fetal sex. PLoS ONE. 2014;9:e87303. doi: 10.1371/journal.pone.0087303. - DOI - PMC - PubMed
    1. Group H.S.C.R. Hyperglycaemia and Adverse Pregnancy Outcome (HAPO) Study: Associations with maternal body mass index. BJOG Int. J. Obstetr. Gynaecol. 2010;117:575–584. - PubMed
    1. Clifton V.L. Review: Sex and the Human Placenta: Mediating Differential Strategies of Fetal Growth and Survival. Placenta. 2010;31:S33–S39. doi: 10.1016/j.placenta.2009.11.010. - DOI - PubMed
    1. Eriksson J.G., Kajantie E., Osmond C., Thornburg K., Barker D.J. Boys live dangerously in the womb. Am. J. Hum. Biol. 2010;22:330–335. doi: 10.1002/ajhb.20995. - DOI - PMC - PubMed

LinkOut - more resources