. 2022 Aug 5;23(15):8728.
doi: 10.3390/ijms23158728.

Heritable Epigenomic Modifications Influence Stress Resilience and Rapid Adaptations in the Brown Planthopper (Nilaparvata lugens)

Affiliations

Heritable Epigenomic Modifications Influence Stress Resilience and Rapid Adaptations in the Brown Planthopper (Nilaparvata lugens)

Ayushi Gupta et al. Int J Mol Sci. .

Abstract

DNA methylation in insects is integral to cellular differentiation, development, gene regulation, genome integrity, and phenotypic plasticity. However, its evolutionary potential and involvement in facilitating rapid adaptations in insects are enigmatic. Moreover, our understanding of these mechanisms is limited to a few insect species, of which none are pests of crops. Hence, we studied methylation patterns in the brown planthopper (BPH), a major rice pest, under pesticide and nutritional stress, across its life stages. Moreover, as the inheritance of epigenetic changes is fundamentally essential for acclimation, adaptability, and evolution, we determined the heritability and persistence of stress-induced methylation marks in BPH across generations. Our results revealed that DNA methylation pattern(s) in BPH varies/vary with environmental cues and is/are insect life-stage specific. Further, our findings provide novel insights into the heritability of stress-induced methylation marks in BPH. However, it was observed that, though heritable, these marks eventually fade in the absence of the stressors, thereby suggesting the existence of fitness cost(s) associated with the maintenance of the stressed epigenotype. Furthermore, we demonstrate how 5-azacytidine-mediated disruption of BPH methylome influences expression levels of stress-responsive genes and, thereby, highlight demethylation/methylation as a phenomenon underlying stress resilience of BPH.

Keywords: DNA methylation; Nilaparvata lugens; adaptive stress response; genetic plasticity; insect epigenetics; plant-insect interactions.


Conflict of interest statement

The authors declare no conflict of interest.

Figures

Figure 1
Figure 1
BPH populations subjected to pesticide and nutritional stress. (A) Mortality curve, estimated by the dose-response (Probit) analysis, for BPH (adults) 24 h after exposure to imidacloprid. LD50 estimate (response vs. amount of active ingredient (a.i.) applied topically per insect) for the field-collected BPH population. (B) LD50 estimate for the BOD population. (C) LC50 mortality curve (response vs. concentration expressed as percentage of soluble concentrate (SL) of imidacloprid) for the BOD population of BPH. The respective LD/LC50 values of BPH populations are indicated by the red lines. (D) Transverse section (TS) of TN1 (susceptible rice variety) stem showing negligible callose deposition on the sieve plates. (E) Thick callose deposition (white arrows) observed in Rathu Heenati (RH; resistant rice variety) after BPH infestation.
Figure 2
Figure 2
Comparison of global DNA methylation profiles of BPH populations. (A) Changes in DNA methylation, upon exposure to pesticide and nutritional stress, in BPH adults (B) Response of BPH nymphs with regard to the genome-wide alterations in their DNA methylation levels upon exposure to stress. Error bar represents SD.
Figure 3
Figure 3
Diagrammatic representation of the location of regulatory motifs detected within the CpG islands, corresponding to stress-responsive genes in BPH. Numbers represent nucleotide position in the sequences.
Figure 4
Figure 4
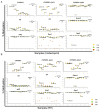
Fluctuations in methylation values of BPH genes (in CG, CHG, and CHH contexts) under stress and after its withdrawal (reversal populations). (A) upon exposure to pesticide (imidacloprid). (B) under nutritional stress (RH).
Figure 5
Figure 5
Estimation of variability in methylation levels of genes, across BPH populations (adults), when subjected to stress. (A) Heatmap depicting alterations in the methylation status of stress-responsive genes upon exposure to imidacloprid. (B) Fluctuations (in methylation of genes) observed under nutritional stress (RH). (C) Whisker plots depicting the degree of variability (viz. methylation) exhibited by genes under pesticide stress. (D) under nutritional (RH) stress. Mean values, quartiles, standard deviation, and outliers are indicated.
Figure 6
Figure 6
Assessment of the relationship between variables (methylation scores) across BPH populations (adults) exposed to stress and after its withdrawal. (A) Principal component analysis (PCA) plot showing distinct methylation patterns in CG and non-CG contexts for pesticide-exposed BPH populations. (B) PCA plots for BPH populations fed on RH. (C) PCA biplot representing the influence of each gene on the selected PCs under pesticide stress. (D) Contribution of each gene to the observed variability under nutritional stress. (E) Hierarchical clustering analysis showing the heritability of pesticide-induced changes in DNA methylation, across generations. (F) Stress-induced changes displaying immediate reversal in the case of nutritional stress. The reversal populations (RT1 and RT2) resembled the control (BOD population), and, hence, were grouped as a separate clade.
Figure 7
Figure 7
Correlation matrix and scatter plots showing Pearson correlation of CpG methylation (for each cytosine), across BPH populations, analysed in the present study. (A) BPH populations under imidacloprid stress (1st generation). (B) BPH populations under imidacloprid stress (4th generation). (C) BPH populations feeding on RH (1st generation). (D) BPH populations feeding on RH (4th generation). Numbers on the upper right corner denote pair-wise Pearson’s correlation scores across samples. The histograms on the diagonal represent CpG methylation level of each sample from 0% to 100% distributed across 10 bins of 10% intervals. Most of the bases have either high or low methylation. The red and green lines on the scatter plots represent linear regression and loess fit, respectively, to model the relationship of differential CpG methylation sites between the compared pairs.
Figure 8
Figure 8
Site-specific analysis of the heritability of stress-induced methylation marks in BPH. Heatmaps were plotted for the cytosine sites (within CpG islands corresponding to stress-responsive genes; AG) that exhibited significant variation between samples, in all three contexts. Gene names are mentioned at the right, and context information is provided at the bottom. Numbers on the right of each plot correspond to sample names, which are as follows: 1. BOD_AD 2. BOD_NY 3. PR 4. RG1 5. RG4 6. RNG1 7. RNG4 8. PI 9. IG1 10. IG4 11. ING1 12. ING4 13. RT1 14. RT2 15. IR1 16. IR2. The colour scale represents an increase in methylation from red to green.
Figure 8
Figure 8
Site-specific analysis of the heritability of stress-induced methylation marks in BPH. Heatmaps were plotted for the cytosine sites (within CpG islands corresponding to stress-responsive genes; AG) that exhibited significant variation between samples, in all three contexts. Gene names are mentioned at the right, and context information is provided at the bottom. Numbers on the right of each plot correspond to sample names, which are as follows: 1. BOD_AD 2. BOD_NY 3. PR 4. RG1 5. RG4 6. RNG1 7. RNG4 8. PI 9. IG1 10. IG4 11. ING1 12. ING4 13. RT1 14. RT2 15. IR1 16. IR2. The colour scale represents an increase in methylation from red to green.
Figure 9
Figure 9
Effect of pharmacological disruption of methylome (5′-azacytidine treatment) on BPH (A) Bar plots showing reduction in cellular DNMT levels and percent methylation across stress-responsive genes in BPH after treatment with azacytidine. Error bars represent SD. (B) Quantitative RT-PCR-based analysis of gene expression performed for BPH populations after treatment with azacytidine and upon exposure to stress (Imidacloprid and nutritional stress). BOD population (untreated and unexposed to stress) was used as a control. The relative gene expression was normalised to the expression level of Actin. The results were analysed using the 2−ΔΔCt method, and the expression level was displayed as relative expression values based on the relative standard curve method. The analysis was based on three biological and three technical replicates.

Similar articles

Cited by

References

    1. Fox R.J., Donelson J.M., Schunter C., Ravasi T., Gaitán-Espitia J.D. Beyond buying time: The role of plasticity in phenotypic adaptation to rapid environmental change. Philos. Trans. R. Soc. B Biol. Sci. 2019;374:20180174. doi: 10.1098/rstb.2018.0174. - DOI - PMC - PubMed
    1. Duncan E.J., Leask M., Dearden P.K. Genome Architecture Facilitates Phenotypic Plasticity in the Honeybee (Apis mellifera) Mol. Biol. Evol. 2020;37:1964–1978. doi: 10.1093/molbev/msaa057. - DOI - PMC - PubMed
    1. Fusco G., Minelli A. Phenotypic plasticity in development and evolution: Facts and concepts. Philos. Trans. R. Soc. B Biol. Sci. 2010;365:547–556. doi: 10.1098/rstb.2009.0267. - DOI - PMC - PubMed
    1. Rodrigues Y.K., Beldade P. Thermal Plasticity in Insects’ Response to Climate Change and to Multifactorial Environments. Front. Ecol. Evol. 2020;8:271. doi: 10.3389/fevo.2020.00271. - DOI
    1. Ylla G., Nakamura T., Itoh T., Kajitani R., Toyoda A., Tomonari S., Bando T., Ishimaru Y., Watanabe T., Fuketa M., et al. Insights into the genomic evolution of insects from cricket genomes. Commun. Biol. 2021;4:733. doi: 10.1038/s42003-021-02197-9. - DOI - PMC - PubMed

LinkOut - more resources