. 2022 Aug 5;23(15):8732.
doi: 10.3390/ijms23158732.

Exploring Ligand Binding Domain Dynamics in the NRs Superfamily

Affiliations

Exploring Ligand Binding Domain Dynamics in the NRs Superfamily

Giulia D'Arrigo et al. Int J Mol Sci. .

Abstract

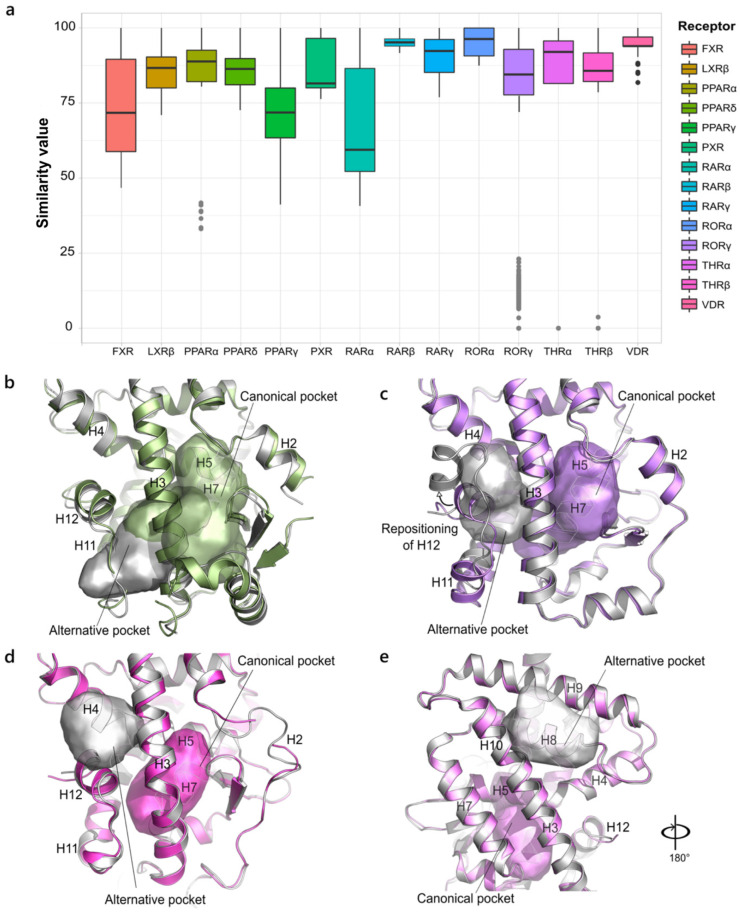
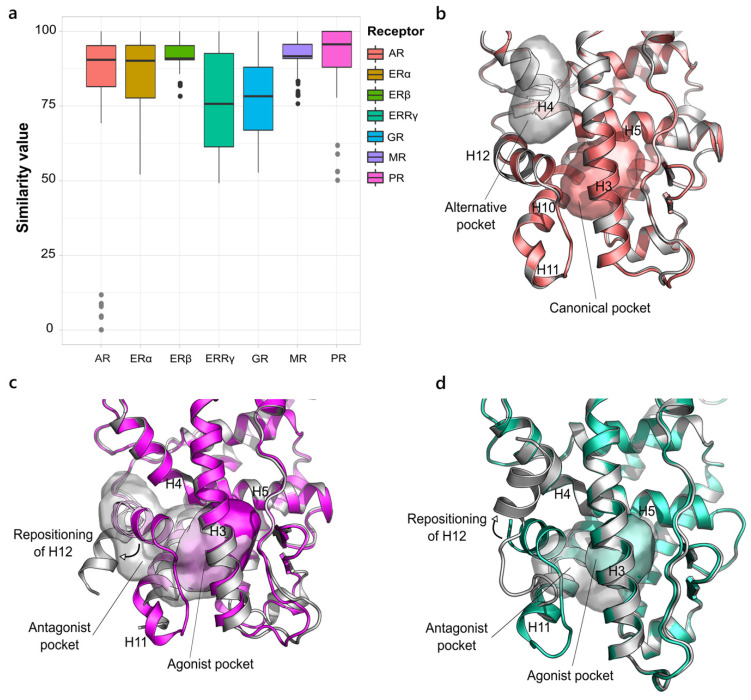
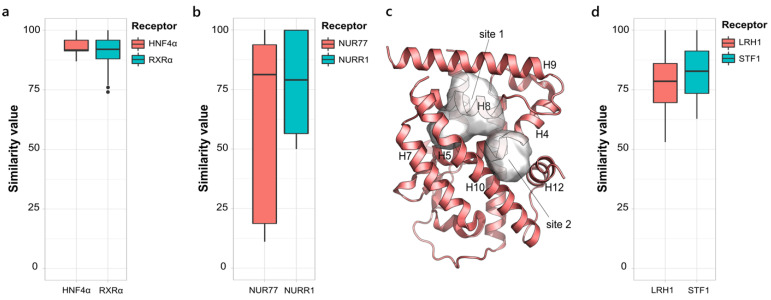
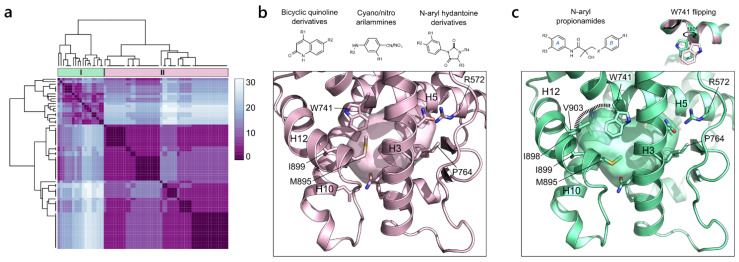
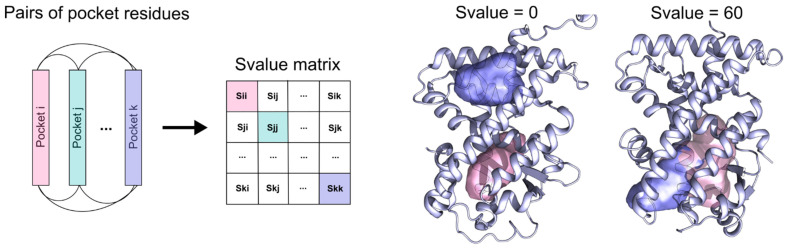
Nuclear receptors (NRs) are transcription factors that play an important role in multiple diseases, such as cancer, inflammation, and metabolic disorders. They share a common structural organization composed of five domains, of which the ligand-binding domain (LBD) can adopt different conformations in response to substrate, agonist, and antagonist binding, leading to distinct transcription effects. A key feature of NRs is, indeed, their intrinsic dynamics that make them a challenging target in drug discovery. This work aims to provide a meaningful investigation of NR structural variability to outline a dynamic profile for each of them. To do that, we propose a methodology based on the computation and comparison of protein cavities among the crystallographic structures of NR LBDs. First, pockets were detected with the FLAPsite algorithm and then an "all against all" approach was applied by comparing each pair of pockets within the same sub-family on the basis of their similarity score. The analysis concerned all the detectable cavities in NRs, with particular attention paid to the active site pockets. This approach can guide the investigation of NR intrinsic dynamics, the selection of reference structures to be used in drug design and the easy identification of alternative binding sites.

Keywords: agonists; antagonists; drug design; flexibility; ligand binding domain; nuclear receptors.


Conflict of interest statement

The authors declare no conflict of interest.

Figures

Figure 1
Figure 1
Variability in NR1 family. (a). Boxplot representing the structural variability in the LBD binding site in the NR1 family. The outlier points corresponding to non-canonical binding pockets are highlighted in grey. (b). Superposition of the canonical active pocket (green, PDB ID 2P54) and the outlier one (grey, PDB ID 5HYK) in PPARα. The two pockets are intersected, as they share some of the residues in helices H3, H5 and H7. (c) Superposition of the canonical active pocket (lilac, PDB ID 5NIB) and the outlier one (grey, PDB ID 5C4S) in RORγ. The newly induced orientation of H12 is indicated by an arrow. (d) Superposition of the canonical active pocket (magenta, PDB ID 2J4A) and the outlier one (grey, PDB ID 2PIN) in THRβ. (e) Superposition of the canonical active pocket (violet, PDB ID 2H79) and the outlier one (grey, PDB ID 4NLW) in THRα.
Figure 2
Figure 2
Variability in NR3 family. (a) Boxplot representing the structural variability in the LBD binding site in the NR3 family. The outlier points corresponding to non-canonical binding pockets are highlighted in grey. (b) Superposition of the canonical active pocket (salmon) and the outlier one (grey) in AR (PDB ID 2PIP). (c,d) Superposition of the agonist pocket of PR (magenta, PDB ID 1A28) and ERRγ (green, PDB ID 2P7G) and the antagonist pocket in grey, (PDB IDs 2OVH and 2GPU, respectively). The two pockets are intersected as they share residues in H3, H5 and H10. The rearrangement of H12 from the agonist to the antagonist conformation is highlighted.
Figure 3
Figure 3
Boxplot representing the structural variability in the LBD binding site in the NR2 family (a), the NR4 family (b) and the NR5 family (d). (c) The two alternative pockets site1 and site2 (PDB IDs 4R38 and 3V3Q, respectively) in NGFI-B, belonging to the NR4 family.
Figure 4
Figure 4
AR variability. (a) Heatmap of the hierarchical clustering of AR. (b) On the bottom, the representation of the pocket from cluster II (PDB ID 1T63) is shown and on top, the general chemical structures of the binding compounds are shown. (c) On the bottom, the representation of the pocket in cluster I (PDB ID 3B67) is shown. On the top, the chemical structure of the N-aryl propionamide compounds and the flipping of W741 responsible for the extension of the binding site in the WT form of AR are shown.
Figure 5
Figure 5
GR variability. (a) Heatmap of the hierarchical clustering of GR. (b) On the bottom, the representation of the pocket from cluster II (PDB ID 4UDC) is shown. A small extension of the canonical pocket is highlighted in magenta (PDB ID 4UDD). On top, the chemical structure of the endogenous ligand, cortisol, is shown, indicating the position for the modulation of steroidal SGRMs. (c) Representation of the extended pocket from cluster I (PDB ID 4CSJ). On the top, the general chemical structure of non-steroidal SGRMs and the flipping of R611, enabling the extension of the binding site, are shown.
Figure 6
Figure 6
ERα variability. (a) Heatmap of the hierarchical clustering of ERα (PDB ID 3UUD). (b) Illustration of the binding mode of the endogenous ligand, 17β-estradiol, in ERα. The main polar interactions are shown with dashed lines. (c) Representation of the canonical pocket resulting from cluster IV (PDB ID 1L2I). On the top, a generic formula of the binding compounds is shown. (d) Depiction of the pocket described by cluster III (PDB ID 5DUH). The receptor is rotated by 180° to highlight the orientation of His524, pushed out from the cavity because of the ligand bulky substituent pointing at it. On top, the chemical structures of the indirect modulators are shown. (e) Representation of the antagonist pocket retrieved from cluster I (PDB ID 2AYR). On top, the chemical structure of the common antagonist molecules that possess a prototypical side chain is shown. (f) Representation of a different antagonist pocket induced by a specific class of SERD molecules (tetrahydroisoquinoline phenols) obtained from cluster II (PDB ID 5FQP).
Figure 7
Figure 7
(a). RORγ variability. Heatmap of the hierarchical clustering of RORγ (PDB ID 5NI5). (b) Illustration of the RORγ binding site. The main areas of the cavity are labelled. (c) Representation of the pocket described by cluster I as a result of the binding of agonist molecules or inverse agonist acting via the “water trap” mechanism (PDB ID 3KYT). (d) Pocket resulted from cluster IV and induced by inverse agonist acting via the “push and pull” mechanism (PDB ID 4WQP). (e) Representation of the pocket of cluster III. H479, pushed out of the binding site, is highlighted in yellow (PDB ID 5 × 8Q). (f) Depiction of the pocket described by cluster II (PDB ID 6Q2W).
Figure 8
Figure 8
(a) Heatmap of the hierarchical clustering of FXR. (b) Superposition of FXR structures containing H2 and H6 in the canonical (pink, PDB ID 5ICK) and non-canonical (green, PDB ID 5Q1H) conformations. (c) Representation of the pocket defined by cluster I (PDB ID 5Q1H) as a result of the binding of compounds that contain a benzimidazolyl acetamide scaffold (reported on the top). (d) Depiction of the pocket illustrated by cluster II (PDB ID 5ICK). (e,f) Representation of the two expanded pockets described by cluster III (PDB IDs 5Q0W and 6A5Y, respectively).
Figure 9
Figure 9
Description of the method. Pairs of pocket residues from the different PDB structures of the same receptor are compared based on the residue index (sequence numbering). The resulting similarity matrix contains all the similarity values (S values) of each pair of pockets. An S value of 0 indicates pockets that are located far within the protein and have no residue in common, while an S value of 60 indicates overlapped pockets that share residues.

Similar articles

Cited by

References

    1. Sever R., Glass C.K. Signaling by Nuclear Receptors. Cold Spring Harb. Perspect. Biol. 2013;5:a016709. doi: 10.1101/cshperspect.a016709. - DOI - PMC - PubMed
    1. Mazaira G.I., Zgajnar N.R., Lotufo C.M., Daneri-Becerra C., Sivils J.C., Soto O.B., Cox M.B., Galigniana M.D. The Nuclear Receptor Field: A Historical Overview and Future Challenges. Nucl. Recept. Res. 2018;5:101320. doi: 10.11131/2018/101320. - DOI - PMC - PubMed
    1. Zhao L., Zhou S., Gustafsson J.-Å. Nuclear Receptors: Recent Drug Discovery for Cancer Therapies. Endocr. Rev. 2019;40:1207–1249. doi: 10.1210/er.2018-00222. - DOI - PubMed
    1. Sherman M.H., Downes M., Evans R.M. Nuclear Receptors as Modulators of the Tumor Microenvironment. Cancer Prev. Res. 2012;5:3–10. doi: 10.1158/1940-6207.CAPR-11-0528. - DOI - PMC - PubMed
    1. Ahmadian M., Suh J.M., Hah N., Liddle C., Atkins A.R., Downes M., Evans R.M. PPARγ Signaling and Metabolism: The Good, the Bad and the Future. Nat. Med. 2013;19:557–566. doi: 10.1038/nm.3159. - DOI - PMC - PubMed

LinkOut - more resources