. 2022 Aug 8;23(15):8818.
doi: 10.3390/ijms23158818.

LEAF TIP RUMPLED 1 Regulates Leaf Morphology and Salt Tolerance in Rice

Affiliations

LEAF TIP RUMPLED 1 Regulates Leaf Morphology and Salt Tolerance in Rice

Jiajia Wang et al. Int J Mol Sci. .

Abstract

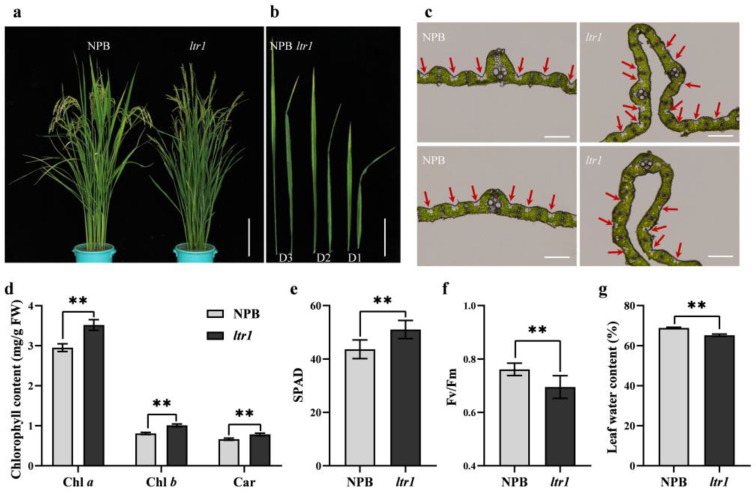
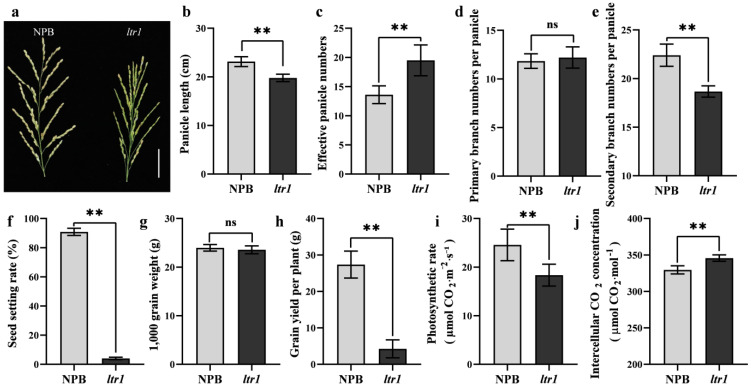
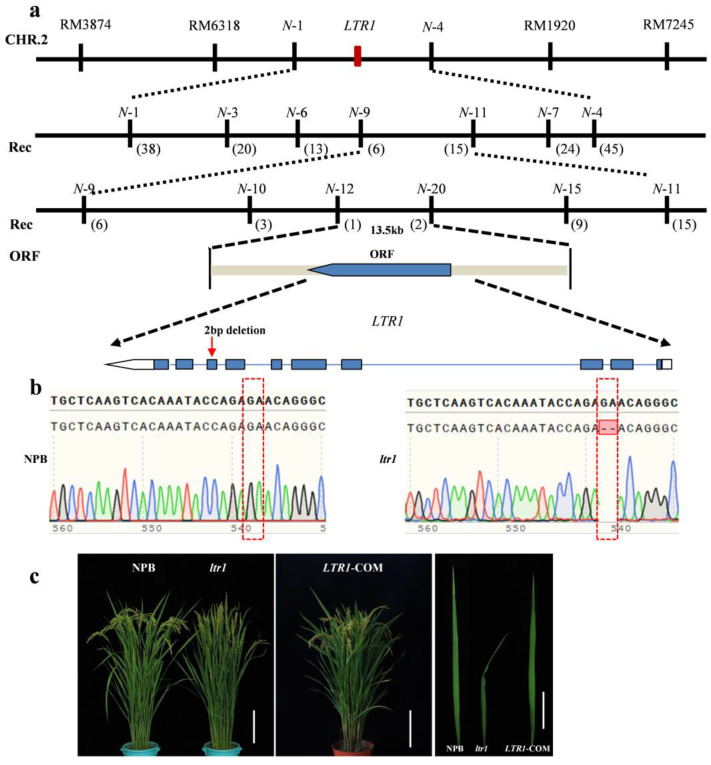
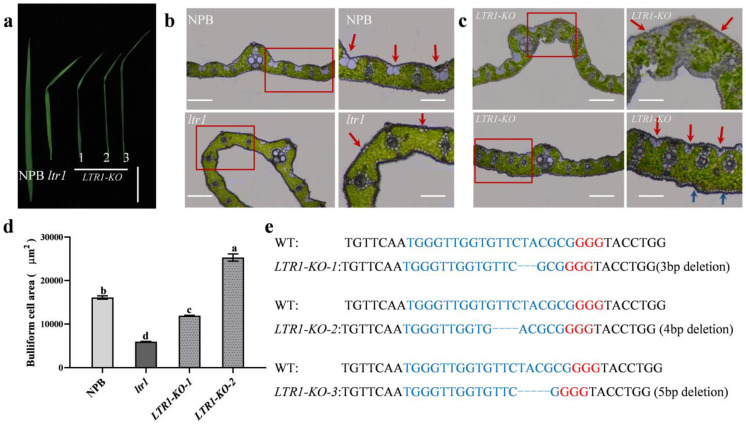
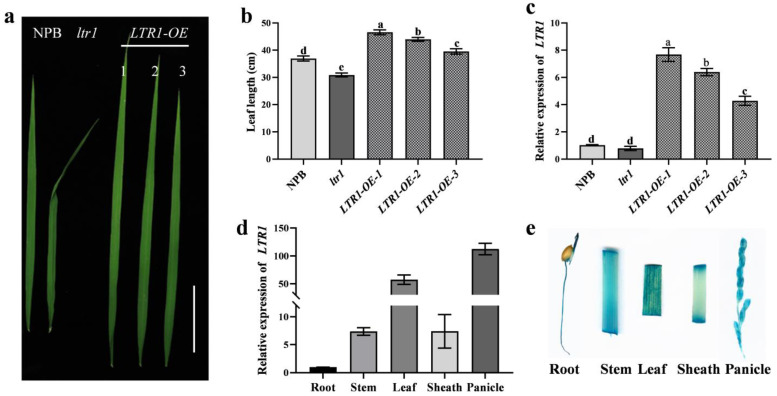
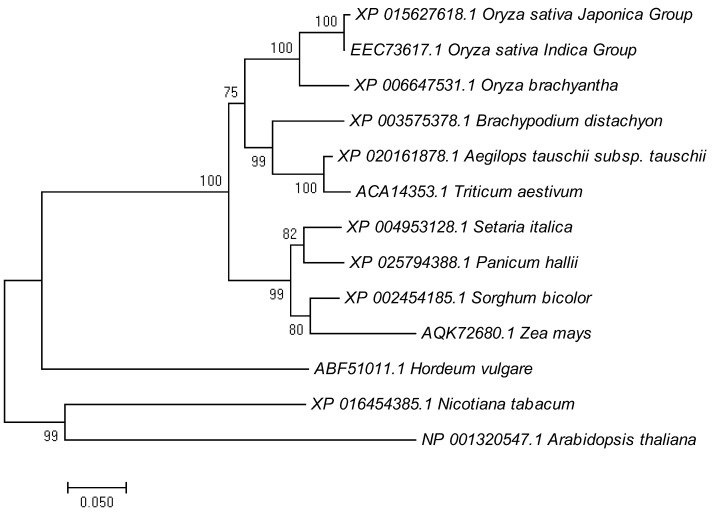
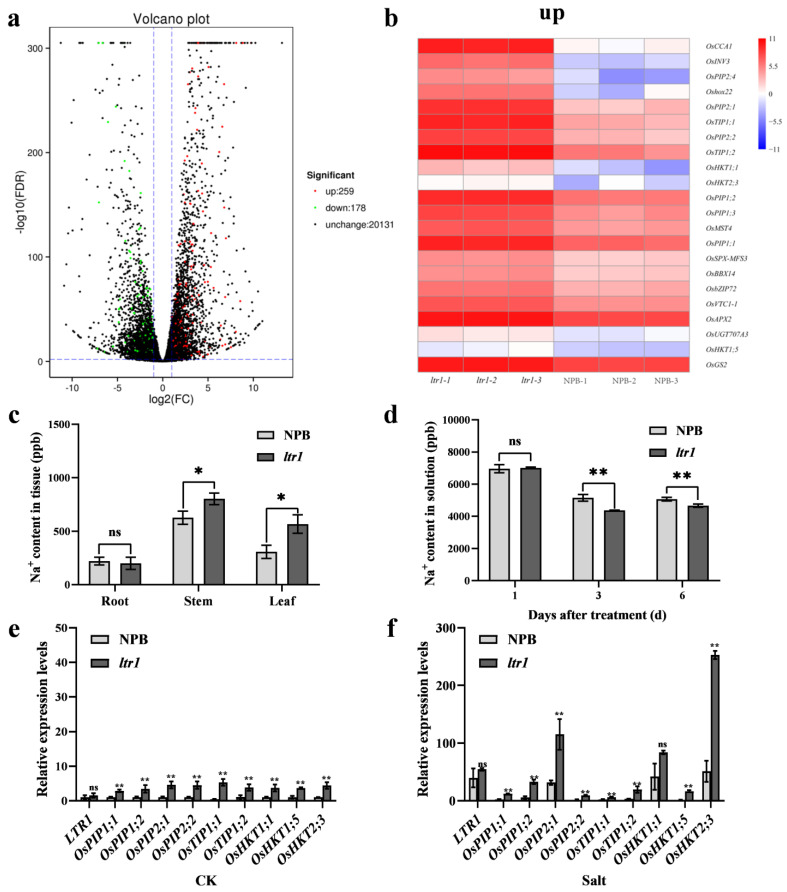
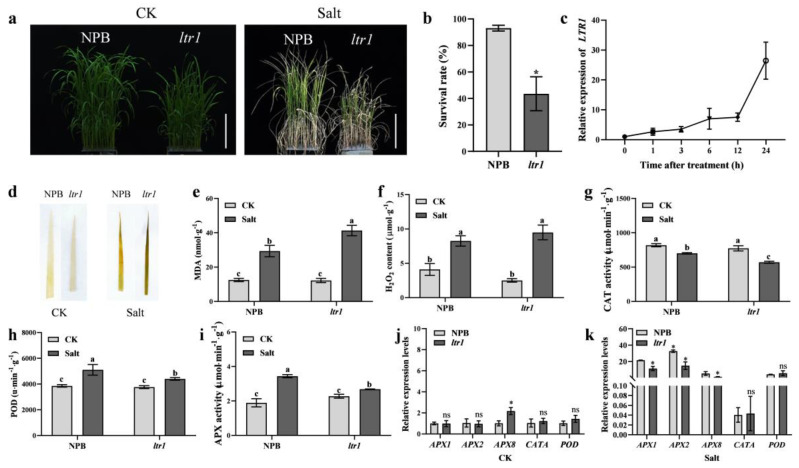
Leaf morphology is one of the important traits related to ideal plant architecture and is an important factor determining rice stress resistance, which directly affects yield. Wax layers form a barrier to protect plants from different environmental stresses. However, the regulatory effect of wax synthesis genes on leaf morphology and salt tolerance is not well-understood. In this study, we identified a rice mutant, leaf tip rumpled 1 (ltr1), in a mutant library of the classic japonica variety Nipponbare. Phenotypic investigation of NPB and ltr1 suggested that ltr1 showed rumpled leaf with uneven distribution of bulliform cells and sclerenchyma cells, and disordered vascular bundles. A decrease in seed-setting rate in ltr1 led to decreased per-plant grain yield. Moreover, ltr1 was sensitive to salt stress, and LTR1 was strongly induced by salt stress. Map-based cloning of LTR1 showed that there was a 2-bp deletion in the eighth exon of LOC_Os02g40784 in ltr1, resulting in a frameshift mutation and early termination of transcription. Subsequently, the candidate gene was confirmed using complementation, overexpression, and knockout analysis of LOC_Os02g40784. Functional analysis of LTR1 showed that it was a wax synthesis gene and constitutively expressed in entire tissues with higher relative expression level in leaves and panicles. Moreover, overexpression of LTR1 enhanced yield in rice and LTR1 positively regulates salt stress by affecting water and ion homeostasis. These results lay a theoretical foundation for exploring the molecular mechanism of leaf morphogenesis and stress response, providing a new potential strategy for stress-tolerance breeding.

Keywords: Oryza sativa L.; aquaporin; bulliform cells; leaf shape; salt stress.


Conflict of interest statement

The authors declare no conflict of interest.

Figures

Figure 1
Figure 1
Phenotype analysis of NPB and ltr1 plants. (a) Plant morphology (bar = 20.0 cm), (b) leaf morphology (bar = 4.0 cm), and (c) observation of frozen sections of NPB and ltr1 (bar = 200 μm), red arrows in (c) represent bulliform cells. (d) Chlorophyll content, (e) SPAD, (f) Fv/Fm, and (g) leaf water content of NPB and ltr1. Data are given as means ± SD. Asterisks indicate significant difference based on the Student’s t-test: ** in the figure represents significant difference at p < 0.01.
Figure 2
Figure 2
Comparisons of yield characters in NPB and ltr1. (a) Spike morphology, bar = 4 cm, (b) panicle length, (c) numbers of effective panicle, (d) number of primary branches, (e) number of secondary branches, (f) seed setting rate, (g) 1000-grain weight, (h) grain yield per plant, (i) photosynthetic efficiency, and (j) intercellular CO2 concentration of NPB and ltr1. Data are given as means ± SD. Asterisks indicate significant difference based on the Student’s t-test: ** in the figure represents significant difference at p < 0.01 and ns in the figure represents there is no significant different at p < 0.05.
Figure 3
Figure 3
Map-based cloning of LTR1. (a) Fine mapping of LTR1; the red arrow represents the mutation site of LTR1 in ltr1. (b) Sequence analysis of NPB and ltr1; the red box represents the mutation site in ltr1. (c) Complementary analysis of LTR1 in ltr1; bar for plants and leaves was 20 cm and 5 cm, respectively.
Figure 4
Figure 4
Phenotypic investigation of LTR1 knockout lines. (a) Photos of leaves in NPB, ltr1, and LTR1-KO lines, bar = 8 cm. (b,c) Frozen section analysis of leaf in NPB, ltr1, and LTR1-KO lines; the red arrow represents bulliform cells, and the blue arrow represents the location of sclerenchyma cells. Right of (b) is the enlarged detail of red box in the left of (b), bar = 200 μm. Right of (c) is the enlarged detail of red box in the left of (c), bar = 100 μm. (d) The area of bulliform cells of LTR1 knockout lines. (e) Sequence analysis of WT and LTR1-KO. Data are given as means ± SD. Significant differences were determined by Duncan’s new multiple range test and indicated with different lowercase letters (p < 0.05).
Figure 5
Figure 5
Overexpression and expression pattern analysis of LTR1. (a) Phenotypic investigation of overexpression lines of LTR1, bar = 6 cm. (b) Leaf length of overexpression lines. (c) The relative expression level of LTR1 in overexpression lines. (d) The relative expression level of LTR1 in different organs of NPB. (e) Promoter activities of LTR1 in different organs of NPB as determined by promoter–GUS assays. Data are given as means ± SD. Significant differences were determined by Duncan’s new multiple range test and indicated with different lowercase letters (p < 0.05).
Figure 6
Figure 6
Phylogenic tree of LTR1 and its homologs. The tree was constructed using MEGA 7.0. Protein sequences are Oryza sativa Japonica Group (XP 015627618.1), Oryza sativa Indica Group (EEC 73617.1), Oryza brachyantha (XP 006647531.1), Brachypodium distachyon (XP 003575378.1), Aegilops tauschii (XP 020161878.1), Triticum aestivum (ACA 14353.1), Setaria italic (XP 004953128.1), Panicum hallii (XP 025794388.1), Sorghum bicolor (XP 002454185.1), Zea mays (AQK 72680.1), Hordeum vulgare (ABF 51011.1), Nicotiana tabacum (XP 016454385.1), Arabidopsis thaliana (NP 001320547.1). Scale represents percentage substitutions per site. Statistical support for the nodes is indicated.
Figure 7
Figure 7
LTR1 regulates salt-stress response by regulating genes encoding aquaporins and ion transporters. (a) Volcano plot of DEGs related to salt response between NPB and ltr1. (b) Heat map of significantly up-regulated DEGs encoding aquaporin and ion transporters between NPB and ltr1. (c) Na+ content in different tissues of NPB and ltr1. (d) Na+ content in solutions where NPB and ltr1 were cultured after treatment for 1, 3, or 6 d. (e) Relative expression levels of LTR1 and genes encoding aquaporin and ion transporters under normal condition (CK). (f) The relative expression levels of LTR1 and genes encoding aquaporin and ion transporters under 150 mM NaCl (Salt). Data are given as means ± SD. Asterisks indicate significant difference based on the Student’s t-test: * in the figure represents significant difference at p < 0.05; ** in the figure represents significant difference at p < 0.01 and ns in the figure represents there is no significant difference at p < 0.05.
Figure 8
Figure 8
The response of LTR1 to salt stress in NPB and ltr1. (a) Photos of NPB and ltr1 under CK and Salt treatment, bar = 10.5 cm. (b) The survival rate of NPB and ltr1 after treatment for 7 d. (c) The relative expression level of LTR1 after treatment for 0, 1, 3, 6, 12, 24 h. (d) DAB staining in leaves of NPB and ltr1 under CK and salt treatment. (e,f) MDA and H2O2 content in leaves of NPB and ltr1 under CK and Salt treatment. (gi) CAT, POD, and APX activity in leaves of NPB and ltr1 under CK and salt treatment. (j,k) The relative expression level of genes related to antioxidant system in leaves of NPB and ltr1 under CK and Salt treatment, n = 4. Data are given as means ± SD. Asterisks indicate significant difference based on the Student’s t-test: * in the figure represents significant difference at p < 0.05 and ns in the figure represents there is no significant difference at p < 0.05. Different lowercase letters indicate significant differences based on the Duncan’s new multiple range test (p < 0.05).

Similar articles

Cited by

References

    1. Zhang G.H., Xu Q., Zhu X.D., Qian Q., Xue H.W. SHALLOT-LIKE1 is a KANADI transcription factor that modulates rice leaf rolling by regulating leaf abaxial cell development. Plant Cell. 2009;217:19–35. doi: 10.1105/tpc.108.061457. - DOI - PMC - PubMed
    1. Li Y.Y., Shen A., Xiong W., Sun Q.L., Luo Q., Song T., Li Z.L., Luan W.J. Overexpression of OsHox32 results in pleiotropic effects on plant type architecture and leaf development in rice. Rice. 2016;94:6. doi: 10.1186/s12284-016-0118-1. - DOI - PMC - PubMed
    1. Xiang J.J., Zhang G.H., Qian Q., Xue H.W. Semi-rolled leaf1 encodes a putative glycosylphosphatidylinositol-anchored protein and modulates rice leaf rolling by regulating the formation of bulliform cells. Plant Physiol. 2012;1591:1488–1500. doi: 10.1104/pp.112.199968. - DOI - PMC - PubMed
    1. Zou L.P., Sun X.H., Zhang Z.G., Liu P., Wu J.X., Tian C.J., Qiu J.L., Lu T.G. Leaf rolling controlled by the homeodomain leucine zipper class IV gene Roc5 in rice. Plant Physiol. 2011;1561:589–1602. - PMC - PubMed
    1. Li Y., Yang Y., Liu Y., Li D., Zhao Y., Li Z., Liu Y., Jiang D., Li J., Zhou H., et al. Overexpression of OsAGO1b induces adaxially rolled leaves by affecting leaf abaxial sclerenchymatous cell development in rice. Rice. 2019;126:60. doi: 10.1186/s12284-019-0323-9. - DOI - PMC - PubMed

LinkOut - more resources