. 2022 Jul 27;11(15):4363.
doi: 10.3390/jcm11154363.

Recovering or Persisting: The Immunopathological Features of SARS-CoV-2 Infection in Children

Affiliations

Recovering or Persisting: The Immunopathological Features of SARS-CoV-2 Infection in Children

Danilo Buonsenso et al. J Clin Med. .

Abstract

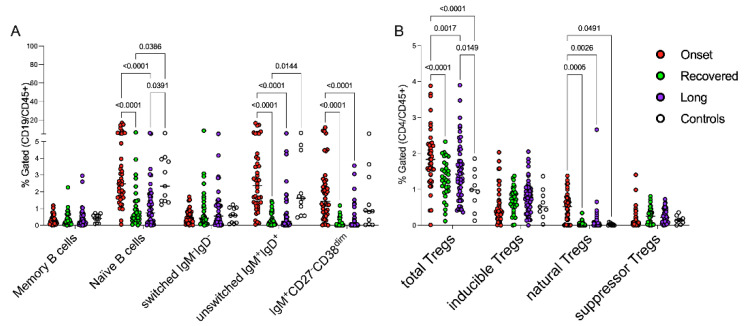
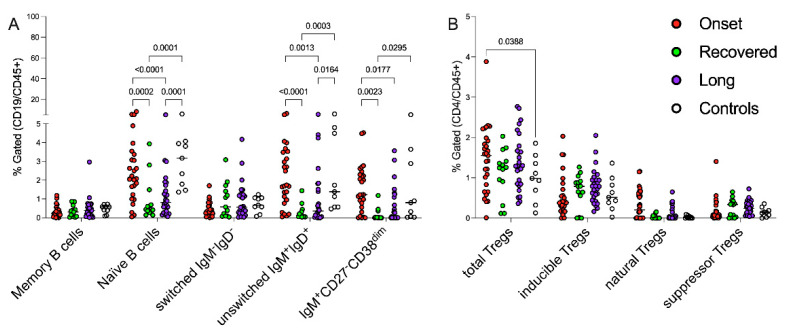
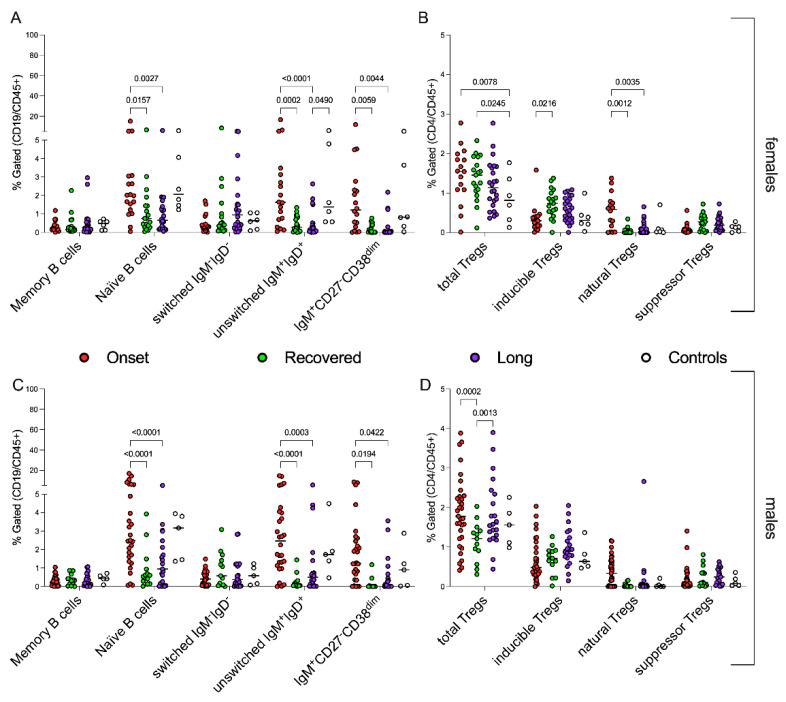
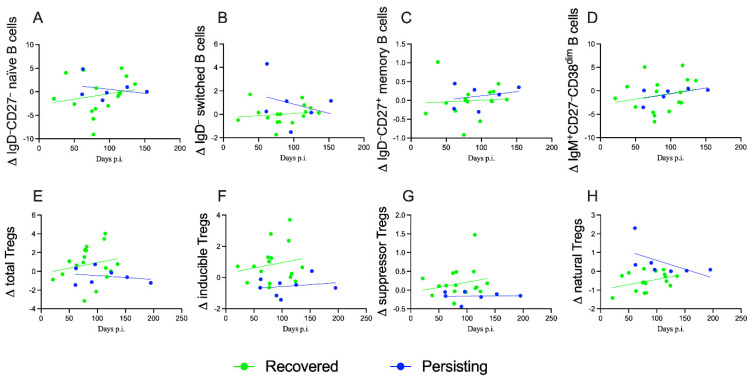
Background. The profile of cellular immunological responses of children across the spectrum of COVID-19, ranging from acute SARS-CoV-2 infection to full recovery or Long COVID, has not yet been fully investigated. Methods. We examined and compared cytokines in sera and cell subsets in peripheral blood mononuclear cells (B and regulatory T lymphocytes) collected from four distinct groups of children, distributed as follows: younger than 18 years of age with either acute SARS-CoV-2 infection (n = 49); fully recovered from COVID-19 (n = 32); with persistent symptoms (Long COVID, n = 51); and healthy controls (n = 9). Results. In the later stages after SARS-CoV-2 infection, the cohorts of children, both with recovered and persistent symptoms, showed skewed T and B subsets, with remarkable differences when compared with children at the onset of the infection and with controls. The frequencies of IgD+CD27− naïve B cells, IgD+IgM+ and CD27−IgM+CD38dim B cells were higher in children with recent infection than in those with an older history of disease (p < 0.0001 for all); similarly, the total and natural Tregs compartments were more represented in children at onset when compared with Long COVID (p < 0.0001 and p = 0.0005, respectively). Despite the heterogeneity, partially due to age, sex and infection incidence, the susceptibility of certain children to develop persistent symptoms after infection appeared to be associated with the imbalance of the adaptive immune response. Following up and comparing recovered versus Long COVID patients, we analyzed the role of circulating naïve and switched B and regulatory T lymphocytes in counteracting the evolution of the symptomatology emerged, finding an interesting correlation between the amount and ability to reconstitute the natural Tregs component with the persistence of symptoms (linear regression, p = 0.0026). Conclusions. In this study, we suggest that children affected by Long COVID may have a compromised ability to switch from the innate to the adaptive immune response, as supported by our data showing a contraction of naïve and switched B cell compartment and an unstable balance of regulatory T lymphocytes occurring in these children. However, further prospective immunological studies are needed to better clarify which factors (epigenetic, diet, environment, etc.) are involved in the impairment of the immunological mechanisms in the Long COVID patients.

Keywords: COVID-19 immunopathology; T cells; childhood SARS-CoV-2 infection; pediatric Long COVID.


Conflict of interest statement

The authors declare no conflict of interest.

Figures

Figure 1
Figure 1
Peripheral blood B and Tregs subsets during the immunopathology of CoV2 infection. Two different panels of antibodies for B cells and Tregs subsets (Duraclone®, Beckman Coulter, Pasadena, CA, USA) were used for staining. Gating strategy for the identification of cell subsets is described in [21]. Each circle represents the percentage of each cell population of the different patients/healthy subjects based on the indicated colors: CoV2-infected children at onset of the disease (red circles), who recovered (green circles), with persistent symptoms (violet circles) and healthy subjects (white circles). The panel (A) displays the different distribution of B-cell subpopulations; panel (B) shows the percentages of Tregs subsets in the different groups. Symbols–or + were used to identify subpopulations with positive or negative markers, respectively, while “high” or “dim” indicate highly or moderately expressed markers respectively. A two-way ANOVA corrected with Tukey were used to statistically examine the data.
Figure 2
Figure 2
Cytokine levels in the sera. Cytokine expression was measured in sera samples of patients and healthy subjects at data entry (ELLA Assay, ProteinSimple, San Jose, CA, USA). Each circle represents the concentration (expressed as picograms/milliliter, pg/mL) of the cytokines for each patient/healthy subject, and the 4 plots compare the four groups. Statistical analyses were performed with a two-way ANOVA corrected with Tukey. (A) IL1β: interleukin 1 β; (B) IL8: interleukin 8; (C) IL6: Interleukin 6; (D) TNFα: tumor necrosis factor α. IL8 plot (Figure 2B) displays a limited number of patients/healthy subjects. The missing ones are not shown because they were undetectable.
Figure 3
Figure 3
Age-related impact of early/late phases of CoV2 infection on B and Tregs lymphocytes. Gating strategy for the identification of cell subsets is described in Figure 1 and in [21]. Each circle represents the percentage of each cell subset or ratio of the different patients/healthy subjects based on the indicated colors: CoV2-infected children at onset of the disease (red circles), who recovered (green circles), with persistent symptoms (violet circles) and healthy subjects (white circles). The panel (A) displays the distributions of B-cell subpopulations in the cohort of patients/controls older than 6 years; the panel (B) shows the percentages of Tregs subsets in children >6 years old. The data were statistically examined using two-way ANOVA corrected with Tukey.
Figure 4
Figure 4
Sex-related B and Tregs subsets, during early/late phases of CoV2 infection. Each circle indicates the percentage of each cell subpopulation or ratio of the different patients/healthy subjects based on the displayed colors: CoV2-infected children at onset of the disease (red circles), who recovered (green circles), with persistent symptoms (violet circles) and healthy subjects (white circles). The panels (A,B) display the sex-related distributions of B-cell subpopulations; the panels (C,D) show the percentages of Tregs subsets in the different groups comparing males with females. Statistical analyses were performed with a two-way ANOVA corrected with Tukey.
Figure 5
Figure 5
Modulation of T and B cells subsets during follow up of CoV2-infected children. Each graph shows the deltas of each variable during time (indicated as days post infection/diagnosis); symbols represent the different patients and are displayed with interpolation lines and confidence bands. The panels compare CoV2-infected children who recovered (green circles and lines) with the ones with persistent symptoms (blue circles and lines). (AD) display B cells subsets: naïve (F = 0.5453. DFn = 1, DFd = 18 and p = 0.4698), switched (F = 1.150. DFn = 1, DFd = 18 and p = 0.2977), memory (F = 0.04023. DFn = 1, DFd = 18 and p = 0.8433) and pre-transitional (F = 0.000019. DFn = 1, DFd = 18 and p = 0.9965) B lymphocytes, respectively. (EH) show regulatory T cell subpopulations: total (F = 0.6585. DFn = 1, DFd = 20 and p = 0.4266), inducible (F = 0.1222. DFn = 1, DFd = 20 and p = 0.7303), suppressor (F = 0.3908. DFn = 1, DFd = 20 and p = 0.5389) and natural (F = 5.761. DFn = 1, DFd = 20 and p = 0.0262) Tregs, respectively. Simple linear regression revealed significant differences of the slopes only for natural Tregs (H).

References

    1. Parri N., Lenge M., Cantoni B., Arrighini A., Romanengo M., Urbino A., Da Dalt L., Verdoni L., Giacchero R., Lanari M., et al. COVID-19 in 17 Italian Pediatric Emergency Departments. Pediatrics. 2020;146:e20201235. doi: 10.1542/peds.2020-1235. - DOI - PubMed
    1. Götzinger F., Santiago-García B., Noguera-Julián A., Lanaspa M., Lancella L., Carducci F.I.C., Gabrovska N., Velizarova S., Prunk P., Osterman V., et al. COVID-19 in Children and Adolescents in Europe: A Multinational, Multicentre Cohort Study. Lancet Child Adolesc. Health. 2020;4:653–661. doi: 10.1016/S2352-4642(20)30177-2. - DOI - PMC - PubMed
    1. CDC COVID-19 Response Team Severe Outcomes among Patients with Coronavirus Disease 2019 (COVID-19)-United States, 12 February–16 March 2020. MMWR Morb. Mortal. Wkly. Rep. 2020;69:343–346. doi: 10.15585/mmwr.mm6912e2. - DOI - PMC - PubMed
    1. Dong Y., Mo X., Hu Y., Qi X., Jiang F., Jiang Z., Tong S. Epidemiology of COVID-19 Among Children in China. Pediatrics. 2020;145:e20200702. doi: 10.1542/peds.2020-0702. - DOI - PubMed
    1. Feldstein L.R., Rose E.B., Horwitz S.M., Collins J.P., Newhams M.M., Son M.B.F., Newburger J.W., Kleinman L.C., Heidemann S.M., Martin A.A., et al. Multisystem Inflammatory Syndrome in U.S. Children and Adolescents. N. Engl. J. Med. 2020;383:334–346. doi: 10.1056/NEJMoa2021680. - DOI - PMC - PubMed

LinkOut - more resources