. 2022 Jul 29;11(15):4425.
doi: 10.3390/jcm11154425.

Effect of Sound Coding Strategies on Music Perception with a Cochlear Implant

Affiliations

Effect of Sound Coding Strategies on Music Perception with a Cochlear Implant

Gaëlle Leterme et al. J Clin Med. .

Abstract

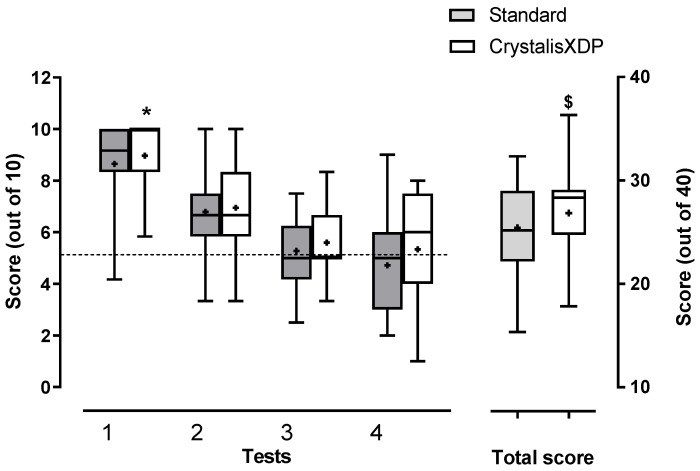
The goal of this study was to evaluate the music perception of cochlear implantees with two different sound processing strategies. Methods: Twenty-one patients with unilateral or bilateral cochlear implants (Oticon Medical®) were included. A music trial evaluated emotions (sad versus happy based on tempo and/or minor versus major modes) with three tests of increasing difficulty. This was followed by a test evaluating the perception of musical dissonances (marked out of 10). A novel sound processing strategy reducing spectral distortions (CrystalisXDP, Oticon Medical) was compared to the standard strategy (main peak interleaved sampling). Each strategy was used one week before the music trial. Results: Total music score was higher with CrystalisXDP than with the standard strategy. Nine patients (21%) categorized music above the random level (>5) on test 3 only based on mode with either of the strategies. In this group, CrystalisXDP improved the performances. For dissonance detection, 17 patients (40%) scored above random level with either of the strategies. In this group, CrystalisXDP did not improve the performances. Conclusions: CrystalisXDP, which enhances spectral cues, seemed to improve the categorization of happy versus sad music. Spectral cues could participate in musical emotions in cochlear implantees and improve the quality of musical perception.

Keywords: cochlear implant; hearing function; music perception; pitch perception; rhythm perception; sound processing strategy.


Conflict of interest statement

The authors declare no conflict of interest.

Figures

Figure 1
Figure 1
Functional Structure of CrystalisXDP. The system extracts the spectral features of the acoustic input by a 128-point Fast Fourier Transform (FFT). A noise reduction algorithm (VoiceTrack) based on spectral subtraction is then applied to enhance the spectral contrast. The 2 diagrams in the VoiceTrack panel show the simulated electrodograms of a human speech sample (dissyllabic word, 4 s), before (top) and after processing (below), generated by an in-house Oticon Medical simulation program as an example. Finally, the multi-band output compression provides adjustable output levels (Y-axis in % of electric dynamic range) as a function of acoustic input (X-axis, dB SPL) in 4 frequency bands.
Figure 2
Figure 2
Spectrograms of the acoustic input, and electrodograms with standard MPIS and Crystalis xDP for 2 samples from test 3 with the same melody in major and minor modes. Spectrograms and electrodograms were simulated on Mathlab software using the same algorithms used in the processors by an in-house Oticon Medical program. For electrodograms, vertical axis shows electrode numbers (from 20 at the apex to 1 at the base) and the horizontal axis shows the number of analysis frames for the total duration of the sample (25 s). Each pixel represents an 8 ms frame sliding every 2 ms. Color codes represent pulse width (µs) coding for intensity for electrodograms and power/frequency (dB/Hz) for the spectrograms. Both strategies produced different electrodograms for minor and major modes. Crystalis xDP showed a richer electrodogram with more spectral cues. Differences between minor and major modes were translated by both temporal and spectral differences (i.e., different activation patterns across channels and within channels).
Figure 3
Figure 3
Scores for music tests with standard (MPIS) and CrystalisXDP sound processing strategies. Each test was marked out of 10, and the total score out of 40. Bars represent mean ± SEM (n = 21). Scores decreased with the difficulty level (*: p < 0.001, mixed model analysis). Patients performed better with CrystalisXDP than with standard program (p < 0.05) regardless of their usual strategy (effect not significant). Total scores were also higher with CrystalisXDP than with MPIS regardless of the patients’ usual strategy ($: p < 0.05, mixed-effects analysis). Box and Whiskers plot represents first and third quartiles, median, and range. Mean is depicted by (+). Dashed line represents chance level.
Figure 4
Figure 4
Correlation between musical test total scores and word discrimination scores (WDS) with cochlear implant (CI) only with standard (MPIS) and CrystalisXDP sound processing strategies. WDS tended to be correlated with total scores in standard condition (right panel, Y = 0.08 * X + 20.2, R = 0.47, p < 0.05, F test) and was significantly correlated to total scores in CrystalisXDP condition (left panel, Y = 0.09 * X + 20.5, R = 0.58, p < 0.01, F-test).
Figure 5
Figure 5
Total music scores as a function of the number of active electrodes with standard (MPIS) and CrystalisXDP strategies. Bilateral and binaural cases are depicted with the number of electrodes in one ear (20 and 12, respectively).
Figure 6
Figure 6
Musical test ratings in terms of ease, clarity and melody liking. Patients scored each item on an auto questionnaire at the end of each test on a Likert scale (1 to 5). Symbols (***) represent individual values (n = 21) and bars represent mean. Ease scores decreased with the difficulty level, but programs (standard or MPIS versus CrystalisXDP) did not influence ratings (p < 0.001 for test levels and not significant for programs, 2-way ANOVA), unpaired t-test versus standard.

References

    1. Musacchia G., Sams M., Skoe E., Kraus N. Musicians have enhanced subcortical auditory and audiovisual processing of speech and music. Proc. Natl. Acad. Sci. USA. 2007;104:15894–15898. doi: 10.1073/pnas.0701498104. - DOI - PMC - PubMed
    1. Limb C.J., Rubinstein J.T. Current research on music perception in cochlear implant users. Otolaryngol. Clin. N. Am. 2012;45:129–140. doi: 10.1016/j.otc.2011.08.021. - DOI - PubMed
    1. Lassaletta L., Castro A., Bastarrica M., Pérez-Mora R., Madero R., De Sarriá J., Gavilán J. Does music perception have an impact on quality of life following cochlear implantation? Acta Otolaryngol. 2007;127:682–686. doi: 10.1080/00016480601002112. - DOI - PubMed
    1. Mandikal Vasuki P.R., Sharma M., Ibrahim R., Arciuli J. Statistical learning and auditory processing in children with music training: An ERP study. Clin. Neurophysiol. 2017;128:1270–1281. doi: 10.1016/j.clinph.2017.04.010. - DOI - PubMed
    1. Patel A.D. Why would Musical Training Benefit the Neural Encoding of Speech? The OPERA Hypothesis. Front. Psychol. 2011;2:142. doi: 10.3389/fpsyg.2011.00142. - DOI - PMC - PubMed

LinkOut - more resources