. 2022 Jul 28;14(15):3097.
doi: 10.3390/nu14153097.

Dietary Inulin Supplementation Affects Specific Plasmalogen Species in the Brain

Affiliations

Dietary Inulin Supplementation Affects Specific Plasmalogen Species in the Brain

Jean-Baptiste Bizeau et al. Nutrients. .

Abstract

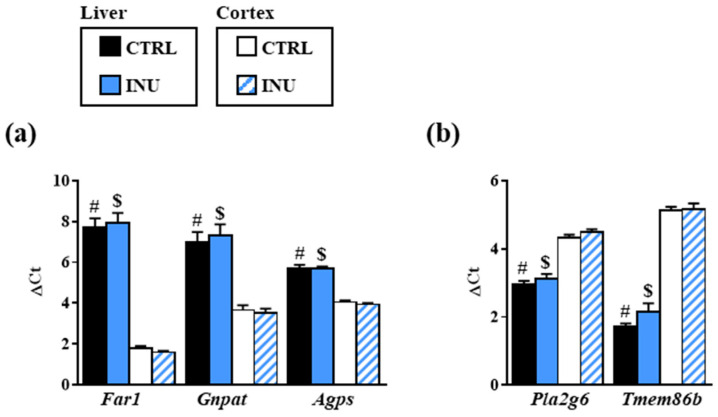
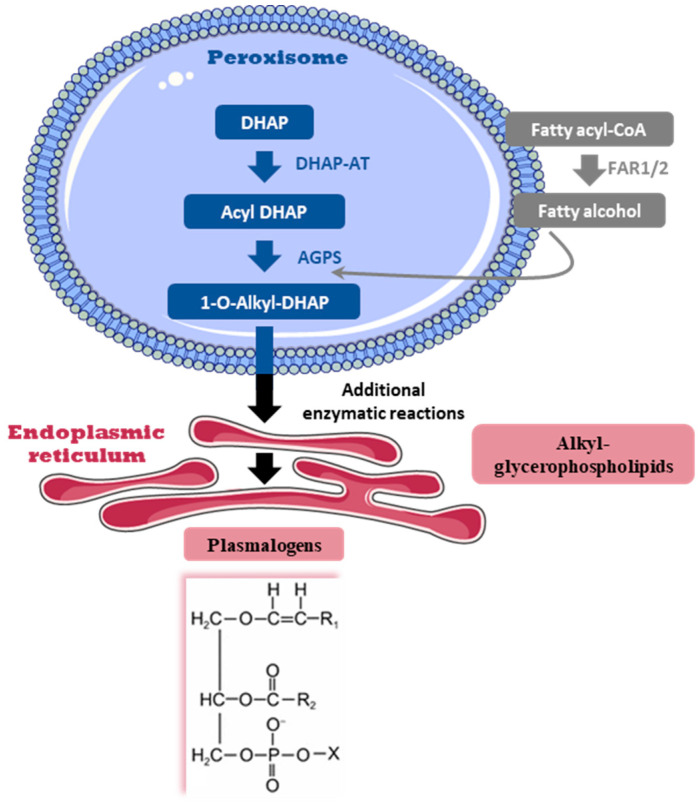
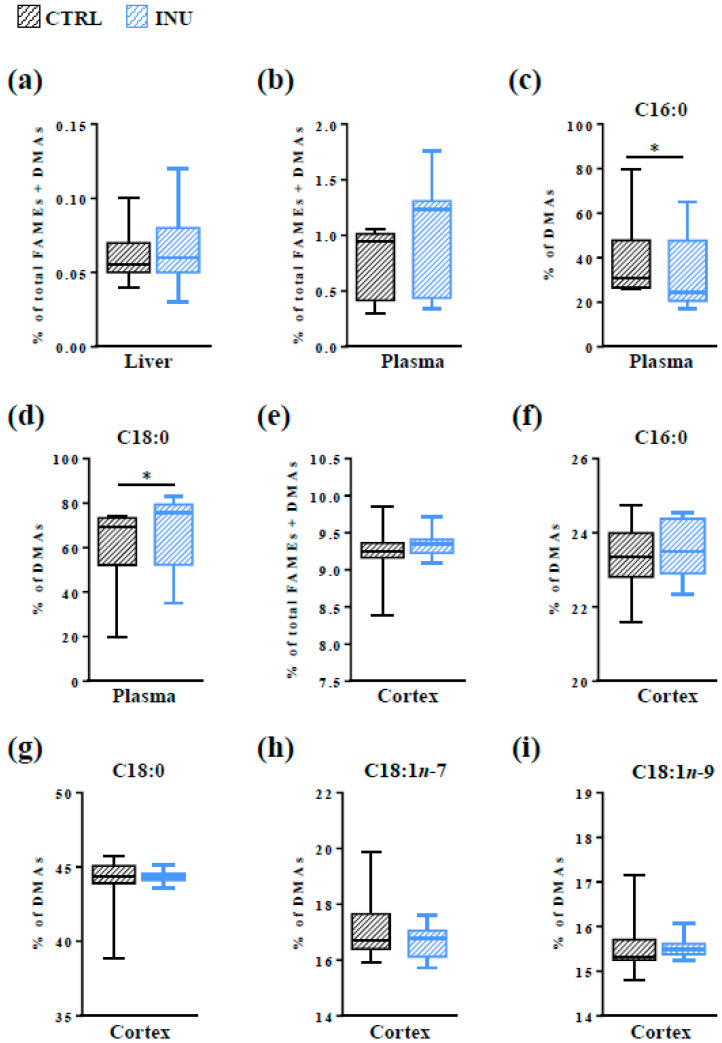
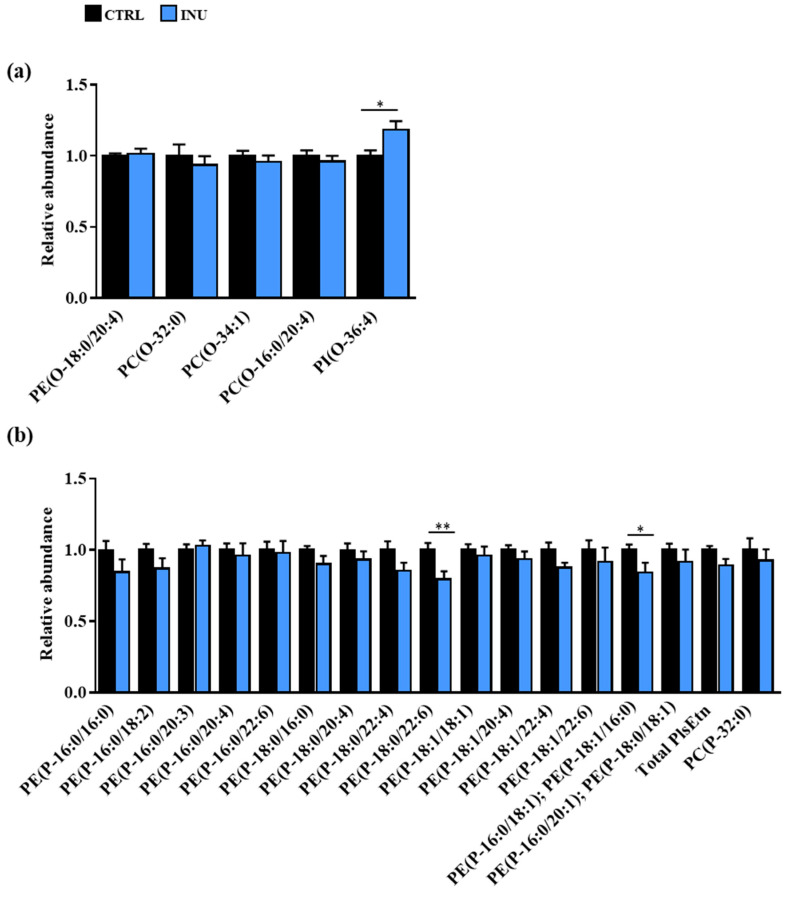
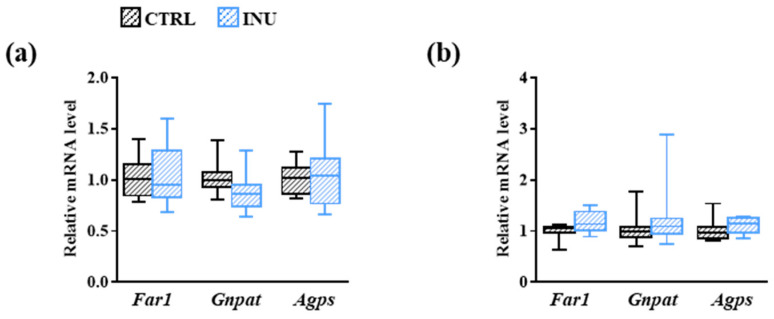
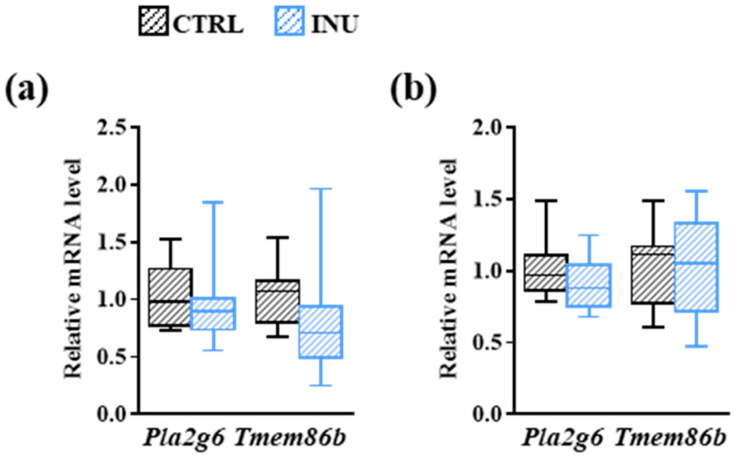
Plasmalogens (Pls) are glycerophospholipids that play critical roles in the brain. Evidence supports the role of diet and that of the gut microbiota in regulating brain lipids. We investigated the impact of dietary intake of inulin-a soluble fiber used as prebiotic-on the Pl content of the cortex in mice. No global modification in the Pl amounts was observed when evaluated by gas chromatographic analysis of dimethyl acetals (DMAs). However, the analysis of individual molecular species of Pls by liquid chromatography revealed a reduced abundance of major species of ethanolamine Pls (PlsEtn)-PE(P-18:0/22:6) and PE(P-34:1)-in the cortex of mice fed a diet supplemented with inulin. DMA and expression levels of genes (Far-1, Gnpat, Agps, Pla2g6 and Tmem86b) encoding key enzymes of Pl biosynthesis or degradation were not altered in the liver and in the cortex of mice exposed to inulin. In addition, the fatty acid profile and the amount of lyso forms derived from PlsEtn were not modified in the cortex by inulin consumption. To conclude, inulin affects the brain levels of major PlsEtn and further investigation is needed to determine the exact molecular mechanisms involved.

Keywords: brain; cortex; dietary fibers; docosahexaenoic acid; fatty acid; glycerophospholipid; inulin; lipid; liver; plasmalogen.


Conflict of interest statement

The authors declare no conflict of interest.

Figures

Figure A1
Figure A1
Expression levels of genes encoding enzymes involved in the biosynthesis (a) or in the degradation (b) of plasmalogens in liver and cortex of mice fed a control diet or a diet supplemented with inulin. (a) Expression levels of genes encoding fatty acyl-CoA reductase 1 (Far1), DHAP-AT/DAP-AT (Gnpat), and alkyl-DHAP synthase (Agps). (b) Expression levels of genes encoding phospholipase A(2) (Pla2g6) and lysoplasmalogenase (Tmem86b). DeltaCt (ΔCt) are presented as mean ± SEM. #, p < 0.0001, Mann–Whitney test for comparison between ΔCt in liver and ΔCt in cortex of control group (CTRL) mice. $, p < 0.0001, Mann–Whitney test for comparison between ΔCt in liver and ΔCt in cortex of inulin group (INU) mice. acyl-CoA, acyl coenzyme A; SEM, standard error of the mean.
Figure 1
Figure 1
Schematic representation of plasmalogen biosynthesis. The biosynthesis of plasmalogens (Pls) is initiated in the peroxisome with three critical steps catalyzed by the enzymes FAR1 (fatty acyl-CoA reductase 1), DHAP-AT (dihydroxyacetone phosphate acyltransferase) and alkyl-DHAP synthase (alkylglycerone-phosphate synthase, AGPS). The biosynthesis of Pls is then continued in the endoplasmic reticulum by additional enzymatic reactions leading to the synthesis of alkyl-glycerophospholipid intermediates. The chemical structure of Pls is presented here. R1 denotes the carbon chain at the sn-1 position, and R2 at the sn-2 position. The polar head group, denoted by X, is most commonly choline or ethanolamine. acyl-CoA, acyl coenzyme A.
Figure 2
Figure 2
Evaluation of plasmalogen (Pl) content in the liver, plasma and cortex by GC-FID. The results represent the quantification of dimethylacetals (DMAs, derivatives of aldehyde aliphatic groups from the sn-1 position of Pls) by GC-FID. (a,b,e) Results are expressed as percentages of total DMAs relative to total fatty acid methyl esters (FAMEs) + total DMAs, defined as 100%, in the liver (a), in the plasma (b) and in the cortex (e). (c,d,fi) percentages of (c,f) DMA 16:0, (d,g) DMA 18:0, (h) DMA 18:1n-7, and (i) DMA 18:1n-9 relative to total DMAs (defined as 100%), in the plasma (c,d) and in the cortex (fi). CTRL: mice fed a control diet. INU: mice fed a diet supplemented with inulin. Data are presented in box and whisker plot format (median; min. to max.). Mann–Whitney test for comparison of lipid abundance between CTRL and INU mice, * p < 0.05. GC-FID, gas chromatography with flame-ionization detection.
Figure 3
Figure 3
Changes in the abundance of AKG and Pl species in the cortex of mice fed a diet supplemented with inulin. (a) AKGs and (b) Pls. Results are expressed as fold change in the cortex of INU mice relative to the mean level observed in the cortex of CTRL mice, defined as 1.0. All data are presented as mean ± SEM. Mann–Whitney test for comparison of each AKG or Pl species abundance between CTRL and INU mice, * p < 0.05, ** p < 0.01. AKG, alkyl-glycerophospholipid; PI, Plasmalogen; SEM, standard error of the mean.
Figure 4
Figure 4
Effect of inulin on the expression of genes encoding enzymes involved in the biosynthesis of plasmalogens. Liver (a) and cortex (b) expression of genes encoding fatty acyl-CoA reductase 1 (Far1), DHAP-AT/DAP-AT (Gnpat), and alkyl-DHAP synthase (Agps) in mice fed a control diet or a diet supplemented with inulin. The levels of mRNA were normalized to Hprt mRNA level for calculation of the relative levels of transcripts. mRNA levels are illustrated as fold change. Data are presented in box and whisker plot format (median, min. to max.). Mann–Whitney test for comparison of the level of each mRNA between CTRL and INU mice.
Figure 5
Figure 5
Effect of inulin on the expression of gene-encoding enzymes involved in the degradation of plasmalogens. Liver (a) and cortex (b) expression of genes encoding phospholipase A(2) (Pla2g6) and lysoplasmalogenase (Tmem86b) in mice fed a control diet or a diet supplemented with inulin. The levels of mRNA were normalized to Hprt mRNA level for calculation of the relative levels of transcripts. mRNA levels are illustrated as fold change. Data are presented in box and whisker plot format (median, min. to max.). Mann-Whitney test for comparison of the level of each mRNA between CTRL and INU mice.
Figure 6
Figure 6
Effect of inulin on the cortex expression of gene-encoding proteins involved in oxidative stress-related mechanisms. Cat encodes catalase, Gpx1 encodes glutathione peroxidase 1, Nos2 encodes inducible nitric oxide (NO) synthase, Sod1 encodes superoxide dismutase (Cu-Zn), Cox-2 encodes cyclooxygenase-2, and Sqstm1 encodes sequestosome-1 (ubiquitin-binding protein p62). The levels of mRNA were normalized to Hprt mRNA level for calculation of the relative levels of transcripts. mRNA levels are illustrated as fold change. Data are presented in box and whisker plot format (median; min. to max.). The Mann–Whitney test was used for comparison of the level of each mRNA between CTRL and INU mice.

References

    1. Adibhatla R.M., Hatcher J.F. Role of Lipids in Brain Injury and Diseases. Future Lipidol. 2007;2:403–422. doi: 10.2217/17460875.2.4.403. - DOI - PMC - PubMed
    1. Hussain G., Anwar H., Rasul A., Imran A., Qasim M., Zafar S., Imran M., Kamran S.K.S., Aziz N., Razzaq A., et al. Lipids as biomarkers of brain disorders. Crit. Rev. Food Sci. Nutr. 2020;60:351–374. doi: 10.1080/10408398.2018.1529653. - DOI - PubMed
    1. Sastry P.S. Lipids of nervous tissue: Composition and metabolism. Prog. Lipid Res. 1985;24:69–176. doi: 10.1016/0163-7827(85)90011-6. - DOI - PubMed
    1. Bozek K., Wei Y., Yan Z., Liu X., Xiong J., Sugimoto M., Tomita M., Paabo S., Sherwood C.C., Hof P.R., et al. Organization and evolution of brain lipidome revealed by large-scale analysis of human, chimpanzee, macaque, and mouse tissues. Neuron. 2015;85:695–702. doi: 10.1016/j.neuron.2015.01.003. - DOI - PubMed
    1. Fitzner D., Bader J.M., Penkert H., Bergner C.G., Su M., Weil M.T., Surma M.A., Mann M., Klose C., Simons M. Cell-Type- and Brain-Region-Resolved Mouse Brain Lipidome. Cell Rep. 2020;32:108132. doi: 10.1016/j.celrep.2020.108132. - DOI - PubMed

LinkOut - more resources