. 2022 Aug 7;14(15):3230.
doi: 10.3390/nu14153230.

Comparative Effects of Allulose, Fructose, and Glucose on the Small Intestine

Affiliations

Comparative Effects of Allulose, Fructose, and Glucose on the Small Intestine

Takuji Suzuki et al. Nutrients. .

Abstract

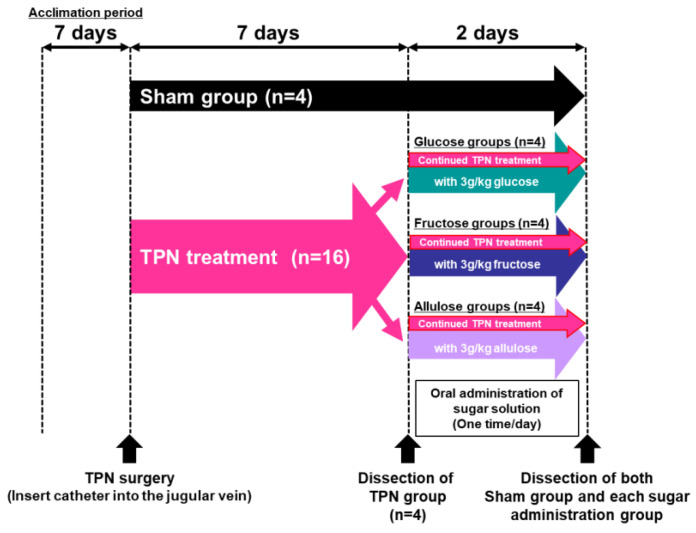
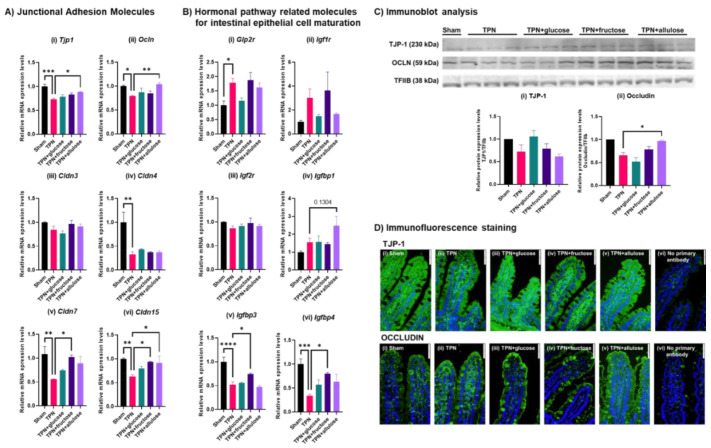
Despite numerous studies on the health benefits of the rare sugar allulose, its effects on intestinal mucosal morphology and function are unclear. We therefore first determined its acute effects on the small intestinal transcriptome using DNA microarray analysis following intestinal allulose, fructose and glucose perfusion in rats. Expression levels of about 8-fold more genes were altered by allulose compared to fructose and glucose perfusion, suggesting a much greater impact on the intestinal transcriptome. Subsequent pathway analysis indicated that nutrient transport, metabolism, and digestive system development were markedly upregulated, suggesting allulose may acutely stimulate these functions. We then evaluated whether allulose can restore rat small intestinal structure and function when ingested orally following total parenteral nutrition (TPN). We also monitored allulose effects on blood levels of glucagon-like peptides (GLP) 1 and 2 in TPN rats and normal mice. Expression levels of fatty acid binding and gut barrier proteins were reduced by TPN but rescued by allulose ingestion, and paralleled GLP-2 secretion potentially acting as the mechanism mediating the rescue effect. Thus, allulose can potentially enhance disrupted gut mucosal barriers as it can more extensively modulate the intestinal transcriptome relative to glucose and fructose considered risk factors of metabolic disease.

Keywords: allulose; fructose; glucose; intestinal barrier; nutrient digestion and absorption; small intestinal function; small intestine.


Conflict of interest statement

This work was partly supported by the funding from Matsutani Chemical Industry Co., Ltd. Purified D-allulose was supplied by the company in accordance with the Material Transfer Agreement between Takuji Suzuki and Matsutani Chemical Industry Co., Ltd. The funders excluding Matsutani Chemical Industry Co., Ltd. had no role in the design of the study; in the collection, analysis, or interpretation of data; in the writing of the manuscript, or in the decision to publish the results. The other authors have no competing interest to disclose.

Figures

Figure 1
Figure 1
Clustering analysis.
Figure 2
Figure 2
Venn diagram analysis.
Figure 3
Figure 3
Gene expression levels of representative genes related to nutrient digestion and absorption, and intestinal barrier. (A) Results of qRT-PCR for carbohydrate digestion/absorption-related genes. (i) Si, (ii) Lct, (iii) Cdx2, (iv) Sglt1, (v) Glut2 and (vi) Glut5. (B) Results of qRT-PCR for fatty acid metabolism-related genes. (i) Fabp1 and (ii) Fabp2. (C) Results of qRT-PCR for tight junction proteins. (i) Tjp1, (ii) Tjp2 and (iii) Tjp3. (D) Results of qRT-PCR for junctional adhesion molecules. (i) Cldn3, (ii) Cldn4, (iii) Cldn7, (iv) Cldn15 and (v) Ocln. Values indicate mean ± SEM (n = 4). Asterisks indicate significant differences tested using the ANOVA-Dunnett’s multiple comparisons test (vs. glucose-perfused group, **** p < 0.0001, *** p < 0.001, ** p < 0.01, * p < 0.05).
Figure 4
Figure 4
Schematic diagram of TPN study procedure.
Figure 5
Figure 5
Villous structure and number of mucus-positive cells. (A): villous structure of (i) sham, (ii) TPN, (iii) TPN + glucose, (iv) TPN + fructose and (v) TPN + allulose rats. (B): mucus-secreting cell staining (alcian blue-PAS double staining) of jejunum (100×, bar = 100 μm). The images are representative tissue of each group. (C): Villous morphometric measurements of (i) villous heights, (ii) crypt depth, (iii) villous width and (iv) villus/crypt ratio. Values indicate mean ± SEM (n = 4, 7–9 villi/animal). Asterisks indicate significant differences tested using the ANOVA-Dunnett’s multiple comparisons test (vs. TPN group, **** p < 0.0001, ** p < 0.01, * p < 0.05).
Figure 6
Figure 6
mRNA expression and protein and activities of representative genes involved in digestion and absorption of nutrients in TPN model of rats. (A) Results of qRT-PCR for carbohydrates digestion/absorption relate genes, (i) Si, (ii) Sglt1 and (iii) Glut5. (B) Results of qRT-PCR for lipid transport related genes, (i) Fabp1, (ii) Fabp2, (iii) Apoa1, (iv) Apob, (v) Apoc3 and (vi) Apoa4. Values indicate mean ± SEM (n = 4). (C) Results of immunoblot analysis for sucrase-isomaltase complex (SI) and fatty acid binding protein 2 (FABP2). Transcriptional factor IIB (TFIIB) is internal control. The graphs indicate relative protein expression levels when the value of Sham group is 1.0., (i) SI and (ii) FABP2. Values indicate mean ± SEM (n = 3). (D) Results of disaccharidase activity assay. (i) sucrase activity, (ii) maltase activity and (iii) lactase activity. Values indicate mean ± SEM (n = 4). Asterisks indicate significant differences tested using the ANOVA-Dunnett’s multiple comparisons test (vs. TPN group, **** p < 0.0001, *** p < 0.001, ** p < 0.01, * p < 0.05).
Figure 7
Figure 7
Expression analysis of representative molecules involved in intestinal barrier function and hormonal pathway molecules related to intestinal epithelial cells maturation in TPN model of rats. (A) Results of qRT-PCR for junctional adhesion molecules-related genes, (i) Tjp1, (ii) Ocln, (iii) Cldn3, (iv) Cldn4, (v) Cldn7 and (vi) Cldn15. (B) Results of qRT-PCR for hormonal pathway-related molecules for intestinal epithelial cell maturation related genes, (i) Glp2r, (ii) Igf1r, (iii) Igf2r, (iv) Igfbp1, (v) Igfbp3 and (vi) Igfbp4. Values indicate mean ± SEM (n = 4). (C) Results of immunoblot analysis for tight junction protein 1 (TJP-1) and occludin (OCLN). Transcriptional factor IIB (TFIIB) is internal control. The graphs indicate relative protein expression levels when the value of Sham group is 1.0. Values indicate mean ± SEM (n = 3). Asterisks indicate significant differences tested using the ANOVA-Dunnett’s multiple comparisons test (vs. TPN group, **** p < 0.0001, *** p < 0.001, ** p < 0.01, * p < 0.05). (D) Results of immunofluorescence staining in jejunal sectional samples, (i) Sham, (ii) TPN, (iii) TPN + glucose, (iv) TPN + fructose, (v) TPN + allulose and (vi) no primary antibody for method control. The images were photographed at 400× magnification. The images are representative tissue of each group. The white scale bar at the top right of each image indicates 50 μm. Upper images indicate TJP-1 (green) and nucleic staining by DAPI (blue). Lower images indicate Occludin (green) and nucleic staining by DAPI (blue).
Figure 8
Figure 8
Concentration of GLP-2, IGF-2, and GLP-1 in plasma of peripheral blood in TPN model of rats and portal vein blood in normal mice. Measurement of total GLP-2 by EIA kit, IGF-2 by ELISA kit and total GLP-1 by ELISA kit in plasma. (A) Total GLP-2 (i) and IGF-2 (ii) concentration in plasma of peripheral blood in TPN model of rats. Values indicate mean ± SEM (n = 4). Asterisks indicate significant differences tested using the ANOVA-Dunnett’s multiple comparisons test (vs. TPN group, **** p < 0.0001, ** p < 0.01). (B) Total GLP-2 (i) and total GLP-1 (ii) concentration in plasma of portal vein blood in normal mice. Values indicate mean ± SEM (n = 6). Asterisks indicate significant differences tested using the ANOVA-Dunnett’s multiple comparisons test (vs. saline group, **** p < 0.0001, *** p < 0.001, * p < 0.05).

References

    1. Oshima: H., Kimura I., Izumori K. Psicose contents in various food products and its origin. Food Sci. Technol. Res. 2006;12:137–143. doi: 10.3136/fstr.12.137. - DOI
    1. Hossain M.A., Kitagaki S., Nakano D., Nishiyama A., Funamoto Y., Matsunaga T., Tsukamoto I., Yamaguchi F., Kamitori K., Dong Y., et al. Rare sugar D-psicose improves insulin sensitivity and glucose tolerance in type 2 diabetes Otsuka Long-Evans Tokushima Fatty (OLETF) rats. Biochem. Biophys. Res. Commun. 2011;405:7–12. doi: 10.1016/j.bbrc.2010.12.091. - DOI - PubMed
    1. Hossain A., Yamaguchi F., Matsunaga T., Hirata Y., Kamitori K., Dong Y., Sui L., Tsukamoto I., Ueno M., Tokuda M. Rare sugar D-psicose protects pancreas beta-islets and thus improves insulin resistance in OLETF rats. Biochem. Biophys. Res. Commun. 2012;425:717–723. doi: 10.1016/j.bbrc.2012.07.135. - DOI - PubMed
    1. Hossain A., Yamaguchi F., Hirose K., Matsunaga T., Sui L., Hirata Y., Noguchi C., Katagi A., Kamitori K., Dong Y., et al. Rare sugar D-psicose prevents progression and development of diabetes in T2DM model Otsuka Long-Evans Tokushima Fatty rats. Drug Des. Devel. Ther. 2015;9:525–535. doi: 10.2147/DDDT.S71289. - DOI - PMC - PubMed
    1. Hayakawa M., Hira T., Nakamura M., Iida T., Kishimoto Y., Hara H. Secretion of GLP-1 but not GIP is potently stimulated by luminal d-Allulose (d-Psicose) in rats. Biochem. Biophys. Res. Commun. 2018;496:898–903. doi: 10.1016/j.bbrc.2018.01.128. - DOI - PubMed