. 2022 Aug 2;27(15):4923.
doi: 10.3390/molecules27154923.

The Combination of Niacinamide, Vitamin C, and PDRN Mitigates Melanogenesis by Modulating Nicotinamide Nucleotide Transhydrogenase

Affiliations

The Combination of Niacinamide, Vitamin C, and PDRN Mitigates Melanogenesis by Modulating Nicotinamide Nucleotide Transhydrogenase

Hyun Jun Park et al. Molecules. .

Abstract

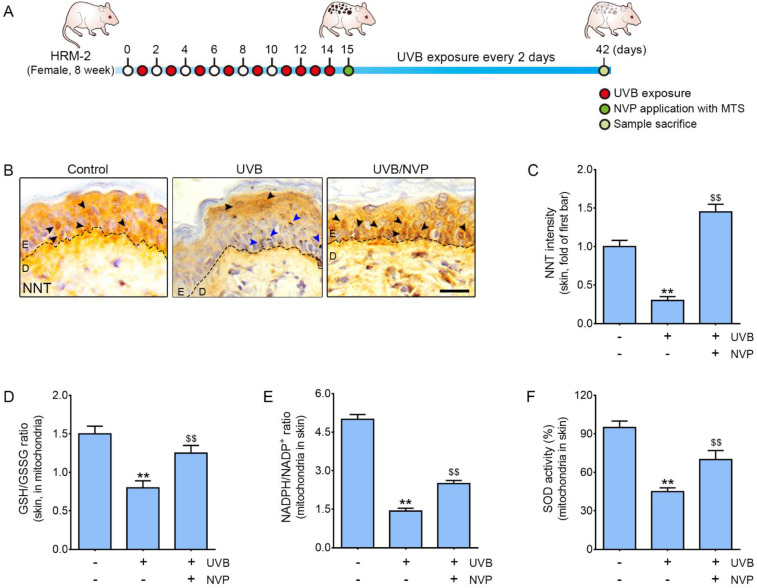
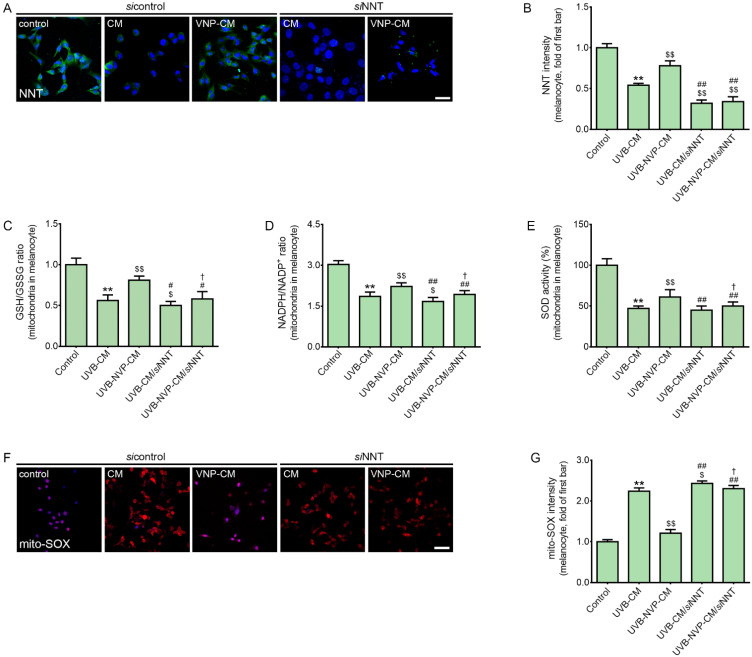
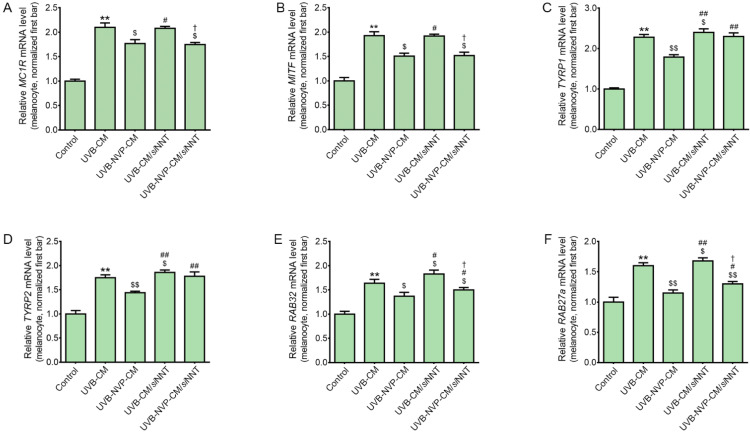
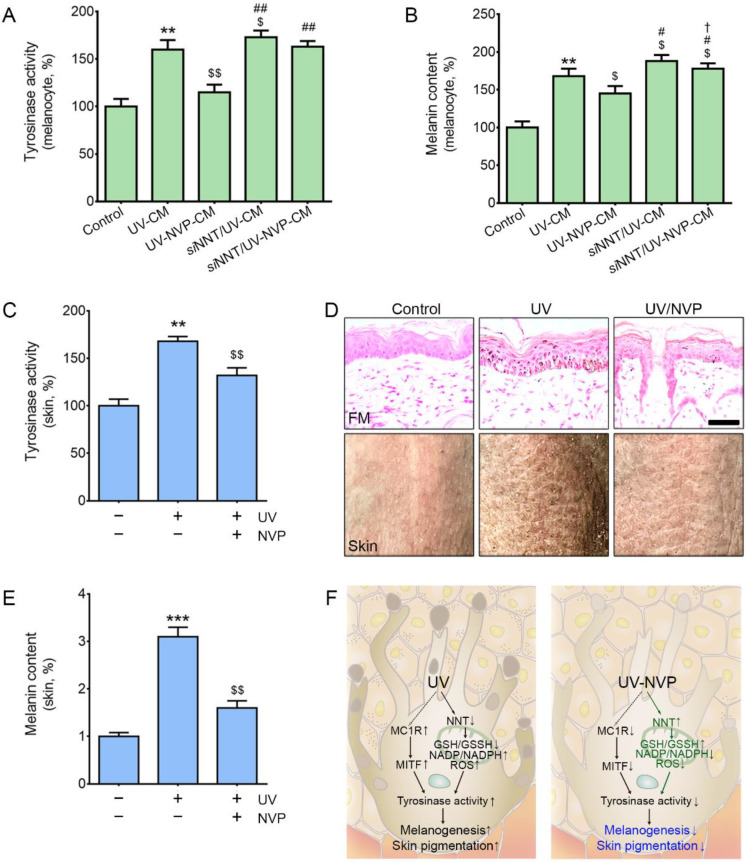
Nicotinamide nucleotide transhydrogenase (NNT) is involved in decreasing melanogenesis through tyrosinase degradation induced by cellular redox changes. Nicotinamide is a component of coenzymes, such as NAD+, NADH, NADP+, and NADPH, and its levels are modulated by NNT. Vitamin C and polydeoxyribonucleotide (PDRN) are also known to decrease skin pigmentation. We evaluated whether a mixture of nicotinamide, vitamin C, and PDRN (NVP-mix) decreased melanogenesis by modulating mitochondrial oxidative stress and NNT expression in UV-B-irradiated animals and in an in vitro model of melanocytes treated with conditioned media (CM) from UV-B-irradiated keratinocytes. The expression of NNT, GSH/GSSG, and NADPH/NADP+ in UV-B-irradiated animal skin was significantly decreased by UV-B radiation but increased by NVP-mix treatment. The expression of NNT, GSH/GSSG, and NADPH/NADP+ ratios decreased in melanocytes after CM treatment, although they increased after NVP-mix administration. In NNT-silenced melanocytes, the GSH/GSSG and NADPH/NADP+ ratios were further decreased by CM compared with normal melanocytes. NVP-mix decreased melanogenesis signals, such as MC1R, MITF, TYRP1, and TYRP2, and decreased melanosome transfer-related signals, such as RAB32 and RAB27A, in UV-B-irradiated animal skin. NVP-mix also decreased MC1R, MITF, TYRP1, TYRP2, RAB32, and RAB27A in melanocytes treated with CM from UV-irradiated keratinocytes. The expression of MC1R and MITF in melanocytes after CM treatment was unchanged by NNT silencing. However, the expression of TYRP1, TYRP2, RAB32, and RAB27A increased in NNT-silenced melanocytes after CM treatment. NVP-mix also decreased tyrosinase activity and melanin content in UV-B-irradiated animal skin and CM-treated melanocytes. In conclusion, NVP-mix decreased mitochondrial oxidative stress by increasing NNT expression and decreased melanogenesis by decreasing MC1R/MITF, tyrosinase, TYRP1, and TYRP2.

Keywords: melanogenesis; niacinamide; nicotinamide nucleotide transhydrogenase; oxidative stress; vitamin C.


Conflict of interest statement

The authors declare no conflict of interest.

Figures

Figure 1
Figure 1
Regulation of the expression of NNT, the GSH/GSSG ratio, the NADPH/NADP+ ratio, and SOD activity after UV-irradiated animal skin was treated with NVP-mix. (A) Schematic diagram of the animal experiment used in this study. (B) NNT expression was determined by immunohistochemical analysis of the epidermal tissues of UV-irradiated mice (scale bar = 100 µm). The black arrows indicate NNT-positive cells, and blue arrows indicate melanin. (C) The intensity of NNT in the epidermis of UV-irradiated animals (image B) was quantified using ImageJ software. (DF) The GSH/GSSG ratio in the mitochondria (D), NADPH/NADP+ ratio in the mitochondria (E), and SOD activity in the mitochondria (F) were measured in UV-irradiated animal skin. Data are presented as the mean ± standard deviation; ** p < 0.01 second bar vs. first bar; $$ p < 0.01 vs. second bar (Mann–Whitney U test). D, dermis; E, epidermis; GSH, glutathione; GSSG, oxidized glutathione; MTS, microneedle therapy system; NADP+, nicotinamide adenine dinucleotide phosphate; NNT, nicotinamide nucleotide transhydrogenase; NVP, niacinamide + vitamin C + polydeoxyribonucleotide; SOD, superoxide dismutase; UV, ultraviolet.
Figure 2
Figure 2
Regulation of the expression of NNT, the GSH/GSSG ratio, the NADPH/NADP+ ratio, SOD activity, and MitoSOX caused by NVP-mix treatment in melanocytes. (A) NNT expression in CM-treated melanocytes was determined by immunocytochemistry (scale bar = 50 µm) (green: NNT; blue: DAPI for nuclear staining). CM was obtained from UV-irradiated keratinocyte cultures treated with PBS or NVP-mix. (B) The intensity of NNT in the cells (image A) was quantified using Zen 2009 software. (CE) The GSH/GSSG ratio in the mitochondria (C), NADPH/NADP+ ratio in the mitochondria (D), and SOD activity in the mitochondria (E) were measured with assay kits after isolation of the mitochondria from CM-treated melanocytes. (F) Mitochondrial peroxide levels were quantified with the fluorescent dye MitoSOX Red by immunofluorescence staining (scale bar = 50 µm) (red: mito-SOX; blue: DAPI for nuclear staining). (G) The intensity of mito-SOX (image F) was quantified using Zen 2009 software. Data are presented as the mean ± standard deviation; ** p < 0.01 second bar vs. first bar; $ p < 0.05, $$ p < 0.01 vs. second bar; # p < 0.05, ## p < 0.01 vs. third bar, † p < 0.05 vs. fourth bar (Mann–Whitney U test). CM, conditioned medium; DAPI, 4′,6-diamidino-2-phenylindole; GSH, glutathione; GSSG, oxidized glutathione; NADP+, nicotinamide adenine dinucleotide phosphate; NNT, nicotinamide nucleotide transhydrogenase; NVP, niacinamide + vitamin C + polydeoxyribonucleotide; SOD, superoxide dismutase; UV, ultraviolet.
Figure 3
Figure 3
Regulation of the expression of MC1R, MITF, TYRP1, TYRP2, RAB32, and RAB27A after NVP-mix treatment to melanocytes. (AF) The mRNA expression levels of MC1R (A), MITF (B), TYRP1 (C), TYRP2 (D), RAB32 (E), and RAB27A (F) were determined by quantitative real-time polymerase chain reaction in CM-treated melanocytes. CM was obtained from UV-irradiated keratinocyte cultures treated with PBS or NVP-mix. The mRNA levels were normalized to that of Actb and are expressed relative to the corresponding level in the control group. Data are presented as the mean ± standard deviation; ** p < 0.01 second bar vs. first bar; $ p < 0.05, $$ p < 0.01 vs. second bar; # p < 0.05, ## p < 0.01 vs. third bar, † p < 0.05 vs. fourth bar (Mann–Whitney U test). CM, conditioned medium; MC1R, melanocortin 1 receptor; MITF, microphthalmia-associated transcription factor; RAB27A, Ras-related protein Rab27A; RAB32, Ras-related protein Rab32; TYRP1, tyrosinase-related protein 1; TYRP2, tyrosinase-related protein 2; NVP, niacinamide + vitamin C + polydeoxyribonucleotide; UV, ultraviolet.
Figure 4
Figure 4
Regulation of tyrosinase activity and melanin content after NVP-mix treatment. (A,B) The tyrosinase activity (A) and melanin contents (B) were determined in CM-treated melanocytes. CM was obtained from UV-irradiated keratinocyte cultures treated with PBS or NVP-mix. (C) Tyrosinase activity was assessed in the UV-irradiated animal skin. (D,E) The melanin contents were assessed with Fontana–Masson staining in UV-irradiated animal skin (D, upper row scale bar = 100 µm). (F) Schematic summary of the effect of NVP-mix after UV irradiation. Data are presented as the mean ± standard deviation; ** p < 0.01, *** p < 0.001 second bar vs. first bar; $ p < 0.05, $$ p < 0.01 vs. second bar; # p < 0.05, ## p < 0.01 vs. third bar, † p < 0.05 vs. fourth bar (Mann–Whitney U test). CM, conditioned medium; FM, Fontana–Masson staining; GSH, glutathione; GSSG, oxidized glutathione; MC1R, melanocortin 1 receptor; MITF, microphthalmia-associated transcription factor; NADP+, nicotinamide adenine dinucleotide phosphate; NNT, nicotinamide nucleotide transhydrogenase; NVP, niacinamide + vitamin C + polydeoxyribonucleotide; ROS, reactive oxygen species; SOD, superoxide dismutase; UV, ultraviolet.

References

    1. Nordlund J.J., Boissy R.E., Hearing V.J., King R.A., Oetting W.S., Ortonne J.P., editors. The Pigmentary System: Physiology and Pathophysiology. John Wiley & Sons; Oxford, UK: 2008. pp. 282–310.
    1. Land E.J., Ito S., Wakamatsu K., Priley P. Rate constants for the first two chemical steps of eumelanogenesis. Pigment Cell Res. 2003;16:487–493. doi: 10.1034/j.1600-0749.2003.00082.x. - DOI - PubMed
    1. Palumbo P., d’Ischia M., Prota G. Tyrosinase-promoted oxidation of 5,6-dihydroxyindole-2-carboxy1ic acid to melanin. Isolation and characterization of oligomer intermediates. Tetrahedron. 1987;43:4203–4206. doi: 10.1016/S0040-4020(01)83461-X. - DOI
    1. Theos A.C., Truschel S.T., Raposo G., Marks M.S. The Silver locus product Pmel17/gp100/Silv/ME20: Controversial in name and in function. Pigment Cell Res. 2005;18:322–336. doi: 10.1111/j.1600-0749.2005.00269.x. - DOI - PMC - PubMed
    1. Napolitano A., Di Donato P., Prota G., Land E.J. Transient quinonimines and 1,4-benzothiazines of pheomelanogenesis: New pulse radiolytic and spectrophotometric evidence. Free Radic. Biol. Med. 1999;27:521–528. doi: 10.1016/S0891-5849(99)00098-2. - DOI - PubMed

LinkOut - more resources