. 2022 Aug 4;27(15):4960.
doi: 10.3390/molecules27154960.

Conformational Dynamics of Human ALKBH2 Dioxygenase in the Course of DNA Repair as Revealed by Stopped-Flow Fluorescence Spectroscopy

Affiliations

Conformational Dynamics of Human ALKBH2 Dioxygenase in the Course of DNA Repair as Revealed by Stopped-Flow Fluorescence Spectroscopy

Lyubov Yu Kanazhevskaya et al. Molecules. .

Abstract

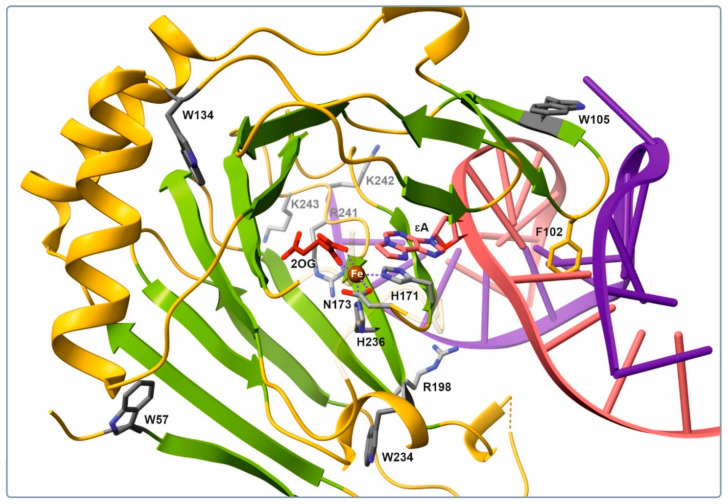
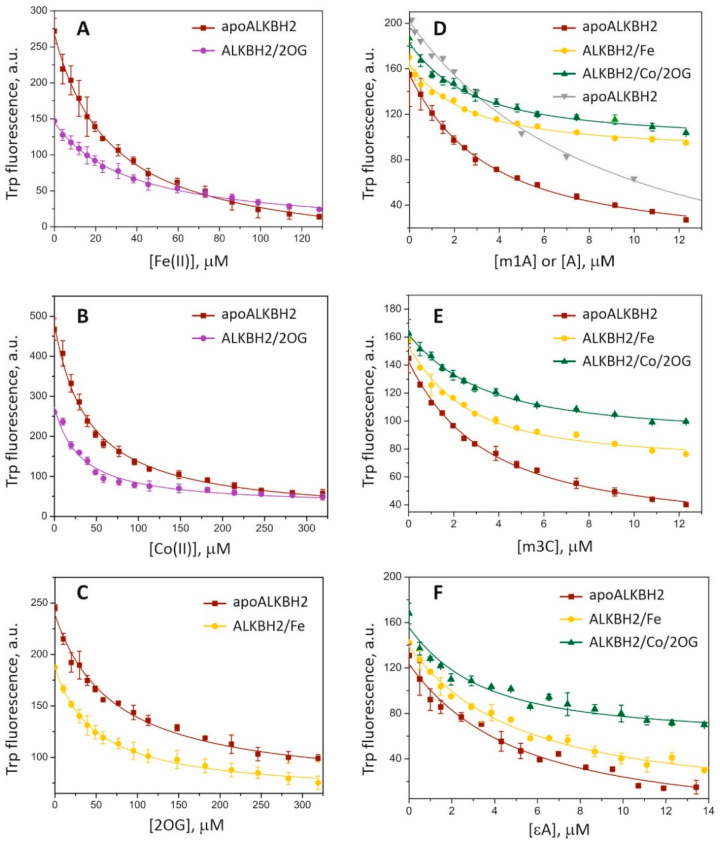
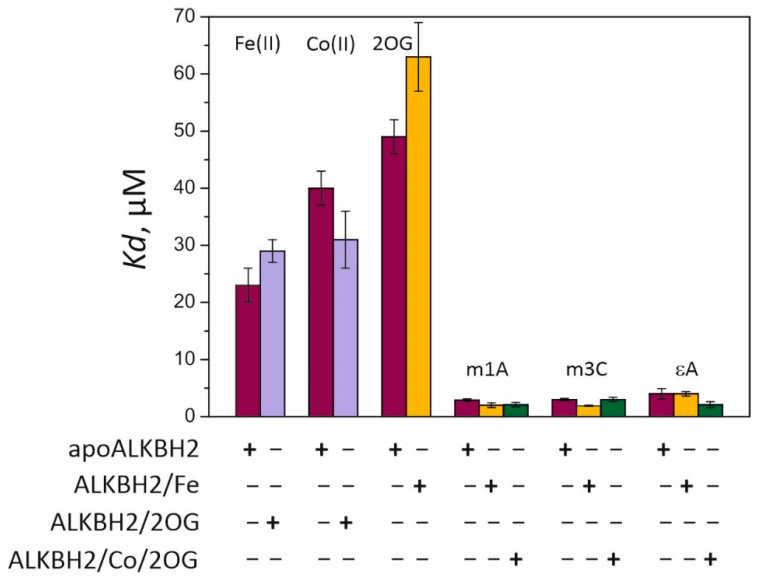
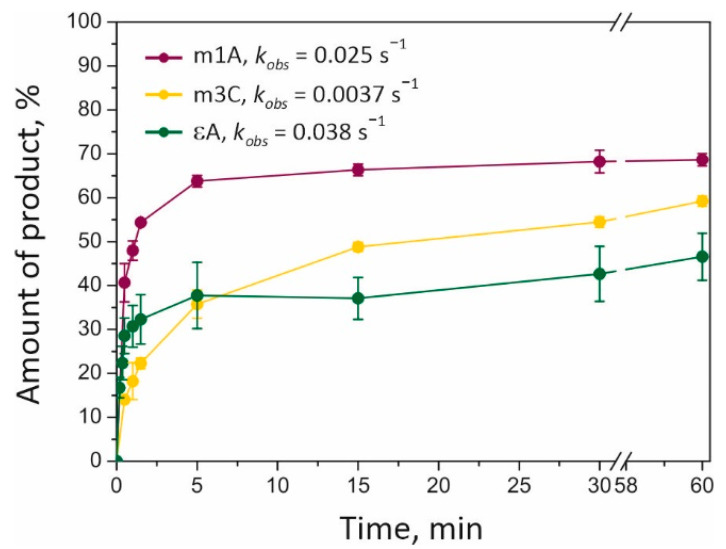
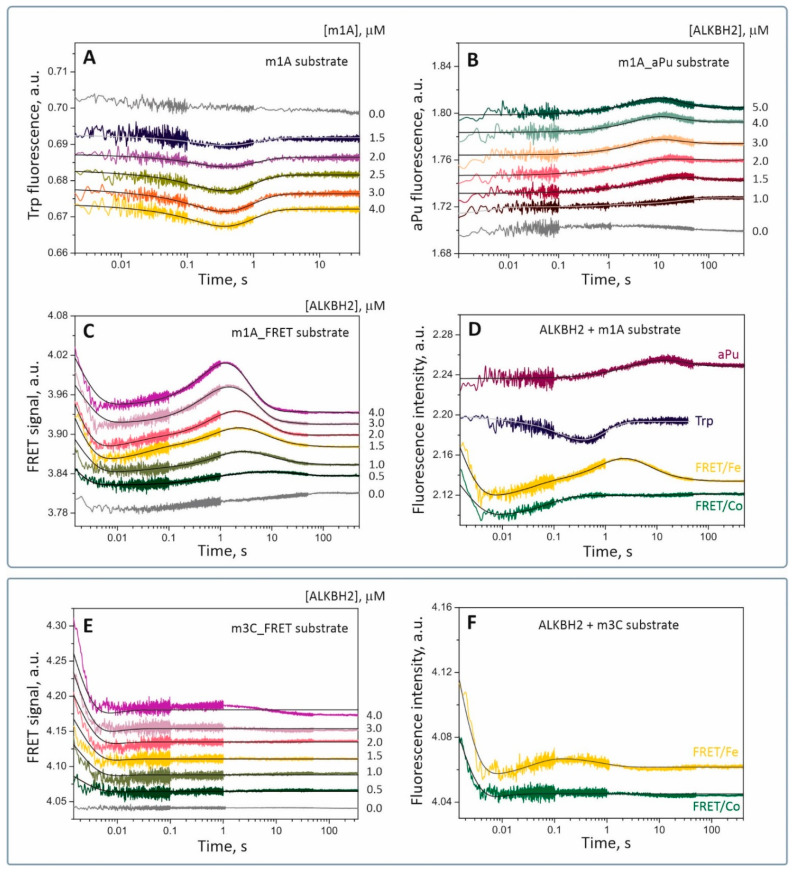
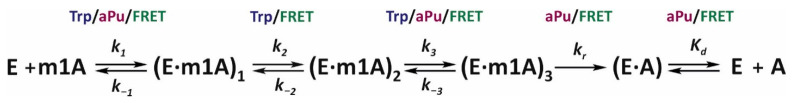
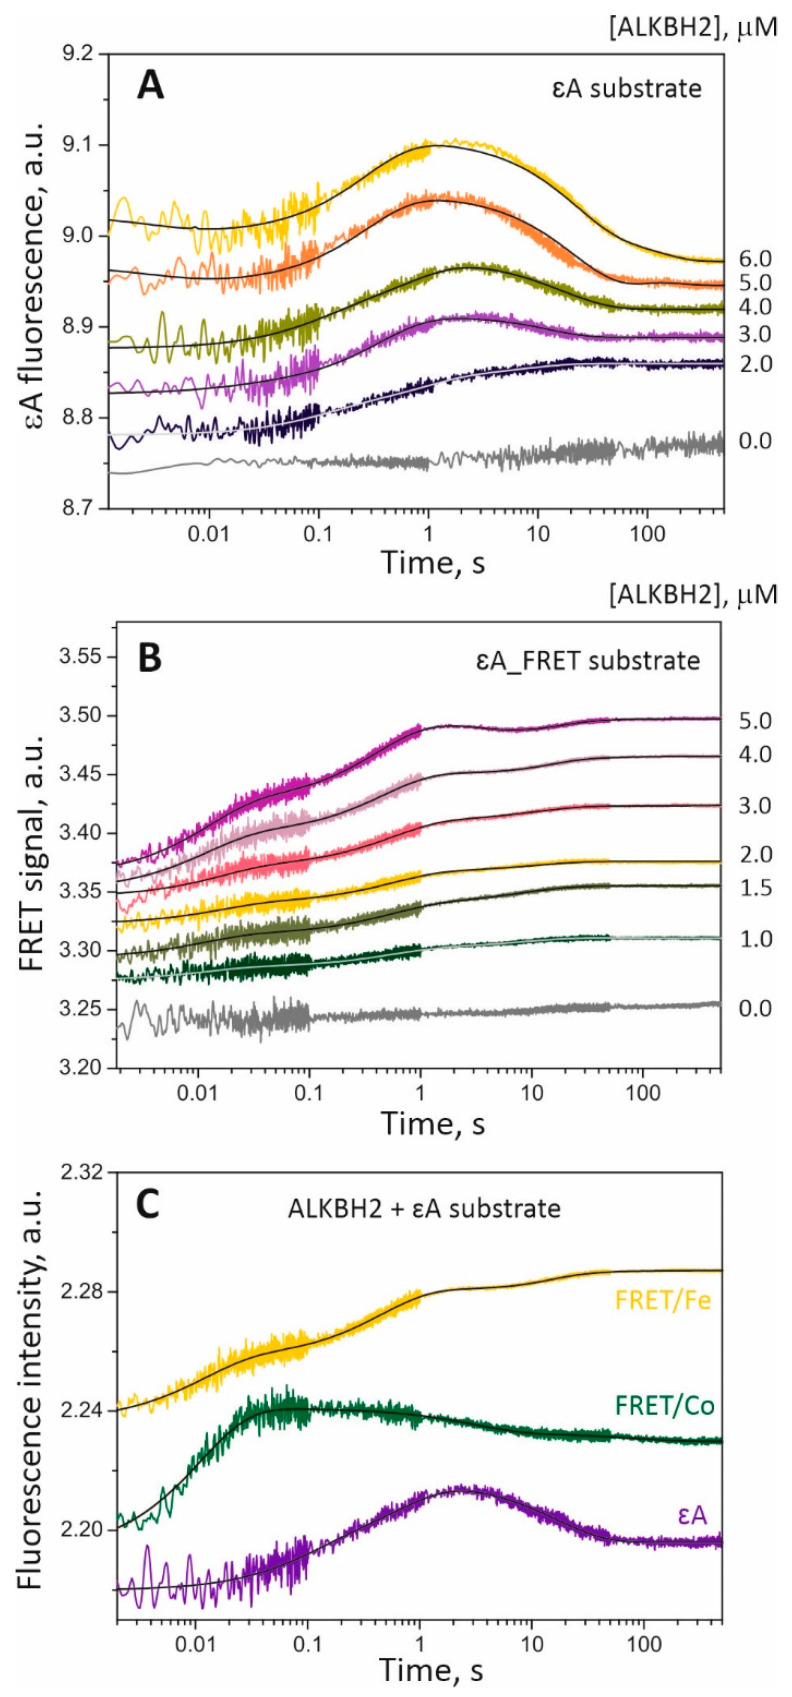
Elucidation of physicochemical mechanisms of enzymatic processes is one of the main tasks of modern biology. High efficiency and selectivity of enzymatic catalysis are mostly ensured by conformational dynamics of enzymes and substrates. Here, we applied a stopped-flow kinetic analysis based on fluorescent spectroscopy to investigate mechanisms of conformational transformations during the removal of alkylated bases from DNA by ALKBH2, a human homolog of Escherichia coli AlkB dioxygenase. This enzyme protects genomic DNA against various alkyl lesions through a sophisticated catalytic mechanism supported by a cofactor (Fe(II)), a cosubstrate (2-oxoglutarate), and O2. We present here a comparative study of conformational dynamics in complexes of the ALKBH2 protein with double-stranded DNA substrates containing N1-methyladenine, N3-methylcytosine, or 1,N6-ethenoadenine. By means of fluorescent labels of different types, simultaneous detection of conformational transitions in the protein globule and DNA substrate molecule was performed. Fitting of the kinetic curves by a nonlinear-regression method yielded a molecular mechanism and rate constants of its individual steps. The results shed light on overall conformational dynamics of ALKBH2 and damaged DNA during the catalytic cycle.

Keywords: DNA methylation; DNA repair; FRET analysis; aminopurine; conformational dynamics; dioxygenase ALKBH2; fluorescent spectroscopy; pre-steady-state kinetics; stopped-flow.


Conflict of interest statement

The authors declare no conflict of interest.

Figures

Figure 1
Figure 1
Closeup view of the active site of ALKBH2 with Fe (brown), 2OG (red), and εA-containing dsDNA (pink/violet) according to Protein Data Bank structure 3RZK [18]. Key coordinating and intercalating amino acid residues are indicated. For clarity, two protein regions (aa 174–179 and 256–258) are shown as 90% transparent cartoons.
Figure 2
Figure 2
Equilibrium binding of ALKBH2 to metal ions, 2OG, or damaged DNA. Trp fluorescence of the enzyme is shown as a function of concentration of a metal ion (A,B), 2OG (C), or DNA substrate (DF). Gray triangles in panel D indicate titration of the ALKBH2/Fe(II)/2OG complex with a 15 nt undamaged ODN containing A instead of m1A. The enzyme concentration was 1 μM. The concentrations of Fe(II), Co(II), and 2OG within preformed ALKBH2/Me(II) or ALKBH2/Me(II)/2OG complexes were 40 μM, 100 μM, and 1 mM, respectively. Fluorescent titration of apoALKBH2 was carried out in the presence of 2 mM EDTA. Experimental data points were fitted to a single-site binding model. Each trace represents the average of three independent assays. In the figures, for better presentation, the curves were manually moved apart.
Figure 3
Figure 3
Analysis of ALKBH2 binding affinity by the equilibrium titration assay. The enzyme was titrated with metal ions (Fe(II) or Co(II)), 2OG, and methylated DNA at 25 °C. Dissociation constants (Kd) were determined by the fitting of experimental data points to a quadratic binding equation (Equation (2); see Section 4.3). The efficiency of ligand binding to apoALKBH2 is presented as wine-colored bars. Kd for the titration of preformed complexes ALKBH2/Fe, ALKBH2/2OG, and ALKBH2/Co/2OG is presented in lilac, yellow, and green colors, respectively. Error bars represent standard deviation of three technical replicates.
Figure 4
Figure 4
ALKBH2-catalyzed repair of m1A-, m3C-, and εA-containing dsODNs. Time courses of the dealkylated-product accumulation were obtained at 25 °C by mixing of 2 μM enzyme with 2 μM FAM-labeled dsDNA substrate dissolved in reaction buffer containing 40 μM Fe (II) and 1 mM 2OG (see Section 4). Each reaction time point is the mean ± SD of three technical replicates.
Figure 5
Figure 5
Interactions of ALKBH2 with m1A- and m3C-containing DNA as measured by the SF method. (A) Time courses of Trp fluorescence intensity obtained for 2 μM enzyme and various concentrations of substrate m1A. (B) Time courses of aPu fluorescence intensity obtained for 2 μM aPu-containing substrate m1A and various concentrations of ALKBH2. (C) Time courses of the FRET signal generated by the FAM/BHQ1 pair in the presence of 1.5 μM DNA substrate and various concentrations of ALKBH2. Gray curves represent control experiments where the fluorescent component was mixed with the buffer. (D) A comparison of SF analysis-derived kinetic curves for different fluorophores and metals in the course of demethylation of substrate m1A. Experimental data on Trp, aPu, and FRET are highlighted in dark blue, wine, and yellow, respectively. The green curve was obtained during interactions of ALKBH2 and a methylated substrate in the presence of Co(II) as a cofactor. (E) Time courses of the FRET signal obtained for 1.5 μM substrate m3C and various concentrations of ALKBH2. (F) A comparison of FRET kinetic curves between cofactors Fe(II) and Co(II) as measured in the course of interactions between ALKBH2 and substrate m3C. For each set of curves, jagged traces represent experimental data. Smoothed curves were obtained via global fitting to kinetic Scheme 1 and Scheme 2.
Scheme 1
Scheme 1
The kinetic mechanism of m1A lesion demethylation by ALKBH2 according to the SF data (Figure 5A–C). E is the enzyme coordinated with Fe(II) and 2OG; m1A is the DNA substrate containing m1A; A is a repaired DNA product; (E∙m1A)i is an intermediate enzyme–substrate complex. Rate constants ki and k−i (i = 1, 2, and 3) characterize forward and reverse directions of the equilibria corresponding to the steps of substrate binding and adjusting for catalysis. Rate constant kr describes the irreversible step of substrate hydroxylation; Kd is an equilibrium constant of enzyme–product complex (E∙A) dissociation and is calculated from the DNA conformational dynamics. The fluorescent probes used for the detection of individual steps are highlighted above the arrows designating the reaction steps.
Scheme 2
Scheme 2
The kinetic mechanism of m3C lesion demethylation by ALKBH2 according to the SF fluorescence data (Figure 5E,F). E is the enzyme coordinated with Fe(II) and 2OG; m3C is a DNA substrate; A is a repaired DNA product; (E∙m3C)i is an intermediate enzyme–substrate complex. Rate constants ki and k−i (i = 1, 2) characterize forward and reverse directions of the equilibria corresponding to the steps of substrate binding and adjustment for catalysis. The fluorescent probes used for the detection of individual steps are highlighted above the arrows designating the reaction steps.
Figure 6
Figure 6
Interactions of ALKBH2 with the εA-containing dsODN as measured by SF analysis. (A) Time courses of the εA fluorescence intensity obtained for 3 μM alkylated DNA and various concentrations of the enzyme. (B) Time courses of FRET between the fluorophore (FAM) and the quencher (BHQ1) as obtained for 2 μM εA-containing dsODN and various concentrations of ALKBH2. (C) Time courses of FRET between the fluorophore (FAM) and the quencher (BHQ1) as determined for 1.5 μM εA-containing dsODN and various concentrations of ALKBH2. Gray curves represent control experiments where the fluorescent component was mixed with the buffer. For each set of curves, jagged traces represent experimental data. Smoothed curves were built via global fitting of the dataset to Scheme 2.
Scheme 3
Scheme 3
The kinetic mechanism of εA lesion demethylation by ALKBH2 according to the SF fluorescence data (Figure 6A,B). E is the enzyme coordinated with Fe(II) and 2OG; εA is a DNA substrate containing εA; A is a repaired DNA product; (E∙εA)i is an intermediate enzyme–substrate complex. The corresponding kinetic parameters are presented in Table 2.

Similar articles

Cited by

References

    1. Aas P.A., Otterlei M., Falnes P.O., Vagbo C.B., Skorpen F., Akbari M., Sundheim O., Bjoras M., Slupphaug G., Seeberg E., et al. Human and bacterial oxidative demethylases repair alkylation damage in both RNA and DNA. Nature. 2003;421:859–863. doi: 10.1038/nature01363. - DOI - PubMed
    1. Duncan T., Trewick S.C., Koivisto P., Bates P.A., Lindahl T., Sedgwick B. Reversal of DNA alkylation damage by two human dioxygenases. Proc. Natl. Acad. Sci. USA. 2002;99:16660–16665. doi: 10.1073/pnas.262589799. - DOI - PMC - PubMed
    1. Hausinger R.P. FeII/alpha-ketoglutarate-dependent hydroxylases and related enzymes. Crit. Rev. Biochem. Mol. Biol. 2004;39:21–68. doi: 10.1080/10409230490440541. - DOI - PubMed
    1. Krebs C., Galonic Fujimori D., Walsh C.T., Bollinger J.M., Jr. Non-heme Fe(IV)-oxo intermediates. Acc. Chem. Res. 2007;40:484–492. doi: 10.1021/ar700066p. - DOI - PMC - PubMed
    1. Ringvoll J., Nordstrand L.M., Vagbo C.B., Talstad V., Reite K., Aas P.A., Lauritzen K.H., Liabakk N.B., Bjork A., Doughty R.W., et al. Repair deficient mice reveal mABH2 as the primary oxidative demethylase for repairing 1meA and 3meC lesions in DNA. Embo J. 2006;25:2189–2198. doi: 10.1038/sj.emboj.7601109. - DOI - PMC - PubMed

MeSH terms

LinkOut - more resources