Review
. 2022 Jul 28;12(15):2600.
doi: 10.3390/nano12152600.

Control of the Drying Patterns for Complex Colloidal Solutions and Their Applications

Affiliations
Review

Control of the Drying Patterns for Complex Colloidal Solutions and Their Applications

Saebom Lee et al. Nanomaterials (Basel). .

Abstract

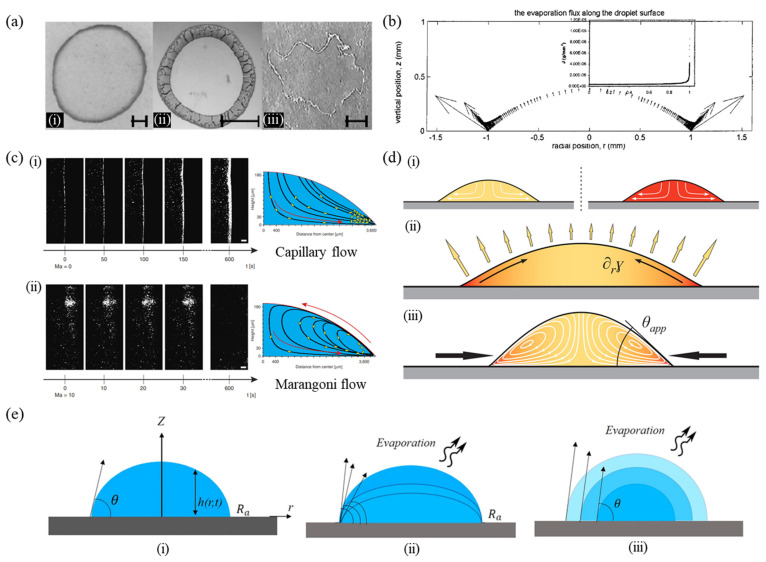
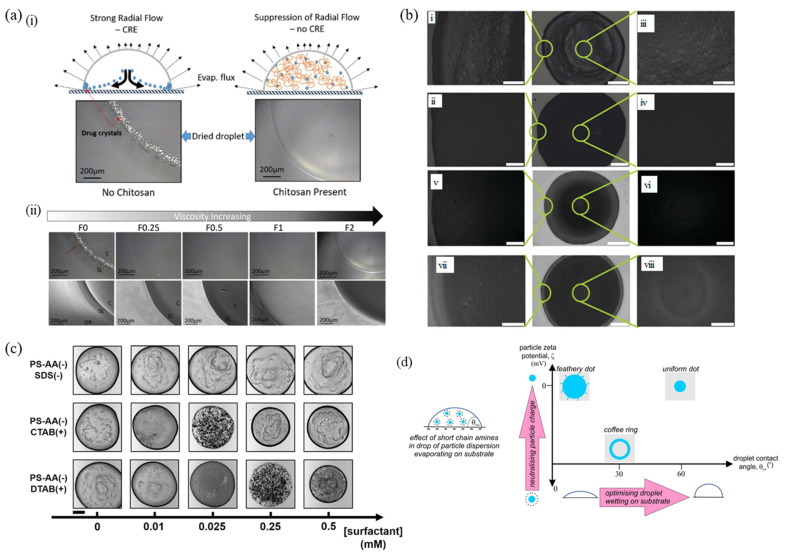
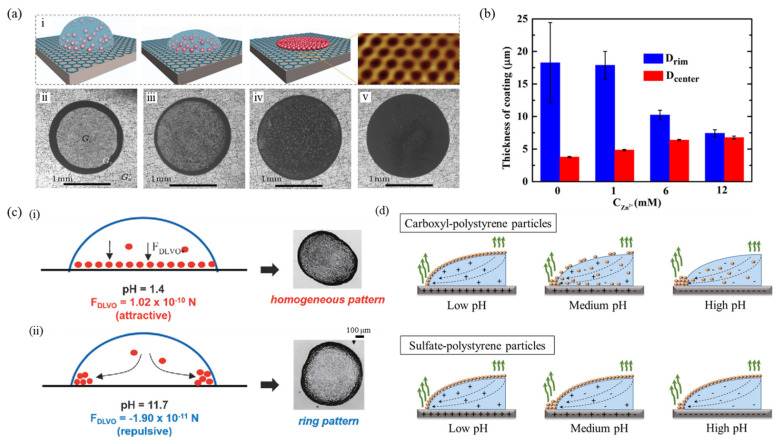
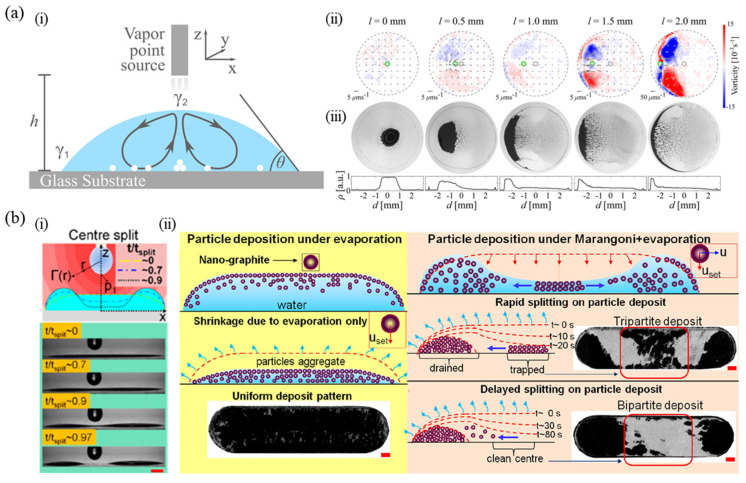
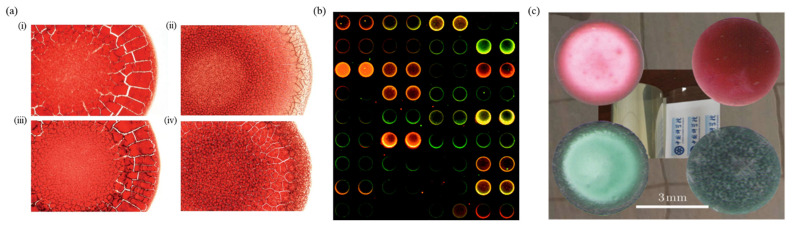
The uneven deposition at the edges of an evaporating droplet, termed the coffee-ring effect, has been extensively studied during the past few decades to better understand the underlying cause, namely the flow dynamics, and the subsequent patterns formed after drying. The non-uniform evaporation rate across the colloidal droplet hampers the formation of a uniform and homogeneous film in printed electronics, rechargeable batteries, etc., and often causes device failures. This review aims to highlight the diverse range of techniques used to alleviate the coffee-ring effect, from classic methods such as adding chemical additives, applying external sources, and manipulating geometrical configurations to recently developed advancements, specifically using bubbles, humidity, confined systems, etc., which do not involve modification of surface, particle or liquid properties. Each of these methodologies mitigates the edge deposition via multi-body interactions, for example, particle-liquid, particle-particle, particle-solid interfaces and particle-flow interactions. The mechanisms behind each of these approaches help to find methods to inhibit the non-uniform film formation, and the corresponding applications have been discussed together with a critical comparison in detail. This review could pave the way for developing inks and processes to apply in functional coatings and printed electronic devices with improved efficiency and device yield.

Keywords: coffee-ring effect; deposition patterns; evaporation; interfacial flow.


Conflict of interest statement

The authors declare no conflict of interest.

Figures

Figure 1
Figure 1
(a) Dried patterns of (i) coffee stain, (ii) colloidal microspheres, and (iii) salt deposit. The scale bar is 1 cm (reproduced with permission from ref. [30]. Copyright 2000 American Physical Society). (b) Evaporation flux along the droplet surface. The inset represents the magnitude of the evaporation flux along the droplet surface (reproduced with permission from ref. [31]. Copyright 2002 American Chemical Society). (c) (i) Capillary flow resulting in a narrow band of bacteria, which accumulates at the edge of the droplet, known as the coffee-ring effect. (ii) Marangoni flow opposing the coffee-ring effect thus creating vortices or swirling of the bacteria in the droplet (reproduced with permission from ref. [112]. Copyright 2013 Springer Nature). (d) (i) Sessile droplets of two separate liquid components, one is water (high surface tension), and the other is ethanol (low surface tension). (ii) An evaporating sessile droplet with a binary mixture of the components with different surface tension and volatilities. (iii) The surface tension gradient induced by evaporation drives a Marangoni flow (reproduced with permission from ref. [114]. Copyright 2017 American Chemical Society). (e) (i) A sessile droplet on a solid substrate. (ii) CCR mode, and (iii) CCA mode of droplet evaporation on a solid substrate (reproduced with permission from ref. [115]. Copyright 2021 AIP Publishing).
Figure 2
Figure 2
(a) (i) Drying process and final pattern of an aqueous droplet of paracetamol with/without chitosan polymer and (ii) Polarising light microscopy/PLM (top) and SEM (bottom) images of the final deposition patterns at the center (C), stagnation line (SL) and outer ring (OR) regions at different chitosan-based formulations, 0, 0.25, 0.5, 1 and 2% (w/w) respectively (reproduced with permission from ref. [121]. Copyright 2021 AIP Publishing). (b) Magnification optical microscope images of SiO2 microspheres at droplet edge (i) without PEO1 and (ii) with PEO1 additives; at droplet center (iii) without PEO1 and (iv) with PEO1 additives; with PEO2 additives (v) at droplet edge and (vi) center; and with PVA additives (vii) at droplet edge and (viii) center. The scale bar is 250 μm for (i–viii), and 1 mm for the middle optical microscope images (reproduced with permission from ref. [55]. Copyright 2012 American Chemical Society). (c) Microscopic images of deposits formed from evaporating droplets (0.8 μL) of mixtures of anionic PS particles (PS-AA, 500 nm diameter, 2 mg/mL) with surfactants (SDS, CTAB, and DTAB) at various concentrations (scale bar is 500 μm) (reproduced with permission from ref. [43] Copyright 2015 American Chemical Society). (d) The effect of short-chain amine adsorption on the silica nanoparticles dispersed in a drop evaporating on a substrate (reproduced with permission from ref. [128]. Copyright 2020 Elsevier).
Figure 3
Figure 3
(a) (i) Schematic of how cations in a drop (blue hemisphere) determine the deposition of PS microspheres (red spheres). Inset shows an atomically resolved scanning tunneling microscope (STM) image of a graphene lattice. (ii)–(v) Optical microscopy images of particle patterns on graphene after evaporation of mixture drops with different salt concentrations (0 mM, 2.0 mM, 4.0 mM, and 8.0 mM, respectively) (reproduced with permission from ref. [67]. Copyright 2020 Chinese Physical Society and IOP Publishing Ltd.). (b) Average thickness at rim and center of PS microsphere suspension mixed with different concentrations of complexed Zn2+ (0, 1.0, 6.0, and 12.0 mM), after evaporation of the sessile drops on the iron surface (reproduced with permission from ref. [71]. Copyright 2020 American Chemical Society). (c) Influence of pH-dependent DLVO interactions of particles with the liquid-solid interface on the deposit morphology from drops of titania nanoparticles drying on glass substrates at (i) acidic and (ii) basic conditions (scale bar is 100 μm) (reproduced with permission from ref. [117]. Copyright 2010 American Chemical Society). (d) Schematic of carboxyl- and sulfate-PS particle deposits at different pH levels (reproduced with permission from ref. [118]. Copyright 2018 Elsevier).
Figure 4
Figure 4
(a) (i) Schematic representation of an evaporating sessile droplet under a vapor point source. (ii) Velocity vectors and vorticity by the Marangoni flows as a function of the lateral displacement 𝑙 of the vapor point source from the droplet’s center for h = 2 mm. (iii) Final deposits after evaporation of sessile drops. The bottom histograms show the corresponding deposit’s density profile along the droplet’s diameter and the densities were averaged along the angular coordinate (reproduced with permission from ref. [102]. Copyright 2018 American Chemical Society). (b) (i) Center split of a long sessile drop by an evaporating ethanol droplet. The scale bar equals 1 mm. (ii) Particle deposition under only evaporation and the combined Marangoni flow and evaporation showing Moses’s effect. Scale bars are 1 mm (reproduced with permission from ref. [103]. Copyright 2020 American Chemical Society).
Figure 5
Figure 5
(a) (i) Dried patterns of sessile drops at various RH levels of 33%, 44%, 52%, 63% and 75%. (ii) Schematic migration processes of microspheres and real-time patterns during evaporation of the sessile drop under 33% and 63% (reproduced with permission from ref. [73]. Copyright 2022 Elsevier). (b) Final deposit pattern of water droplet containing PS particles of 100 nm as a function of the substrate temperature (reproduced with permission from ref. [78]. Copyright 2015 Royal Society of Chemistry). (c) Mechanism of the deposit formation on (i) a uniformly heated substrate and (ii) a non-uniformly heated substrate depending on the diameter of particles (reproduced with permission from ref. [79]. Copyright 2020 Elsevier).
Figure 6
Figure 6
(a) Drying procedure of droplets containing polytetrafluoroethylene (PTFE) particles of 60 wt.% (i) without and (ii) with air bubbles on monocrystalline silicon wafers. (iii) Side views of the drying process of a 5  μL droplet with and without bubbles (reproduced with permission from ref. [135]. Copyright 2020 Elsevier). (b) Evaporative crystallization process of the light-induced droplet and final deposition patterns under the light-induced, plate-heating-induced, and natural evaporation on the (i) hydrophobic and (ii) hydrophilic surfaces (reproduced with permission from ref. [136]. Copyright 2021 American Chemical Society). (c) Schematic illustration of a droplet excited by SAW and images showing the drying patterns of a colloidal drop under SAW with time (reproduced with permission from ref. [52]. Copyright 2015 Royal Society of Chemistry). (d) Effect of the applied magnetic field on the ring thickness. (i) 0 T, (ii) 0.005 T, (iii) 0.02 T, (iv) 0.07 T, (v) 0.1 T, and (vi) 0.15 T (reproduced with permission from ref. [107]. Copyright 2017 AIP Publishing).
Figure 7
Figure 7
(a) (i) Schematic of the experimental set-up used to generate colloidal dispersion drops on substrates placed at different inclinations. CCD camera (image recorder) captures a side view and top view of the drop and an optical microscope is used to study the kinetics of drop evaporation, and (ii) illustrations show the components of velocity experienced by particles in a drop drying at different substrate inclinations: the direction of particle velocity parallel and perpendicular to the substrate in advancing side (respectively labeled as vadv and vadv) and receding side (respectively labeled as vrec and vrec) (reproduced with permission from ref. [147]. Copyright 2021 Royal Society of Chemistry). (b) Comparison of patterns obtained from the drying drops of colloidal dispersions in sessile and pendant modes for (i) (1) 22 nm iron oxide particles (initial contact diameter ∼8 mm) deposited, and (2), (3) and (4) dried on a glass substrate at different concentrations of 0.0001 wt.%, 0.01 wt.% and 1 wt.%, respectively (reproduced with permission from ref. [141]. Copyright 2011 Elsevier). (ii) Drops (10 μL) containing PS colloidal particles (0.1 wt.% and initial contact radius of 1.5 mm) of different particle sizes. The scale bar is 3 mm (reproduced with permission from ref. [149]. Copyright 2018 American Chemical Society). (iii) Drops (2 μL) containing hematite ellipsoids (∼59 nm diameter, ∼244 nm long) at a concentration of 0.12 wt.% on substrates of different wettabilities, namely θ = 12 ± 3°, 30 ± 5°, 90 ± 2°, and 120 ± 5°. The scale bar is 500 μm (reproduced with permission from ref. [143]. Copyright 2018 American Chemical Society).
Figure 8
Figure 8
(a) Internal flow fields of an ethanol–water (70:30 vol%) mixture droplet (i) on an open and (ii) in confined geometry. Deposition patterns of quantum dots (QDs) (iii) on an open and (iv) in a confined space (reproduced with permission from ref. [94]. Copyright 2021 Royal Society of Chemistry). (b) (i–vi) crack formation in the deposit patterns of PTFE colloidal droplets on glass slides with different roughness: (i) smooth glass and (ii–vi) increasing surface roughness which is obtained using sandpaper with different grit sizes (1500, 1000, 800, 400, and 200, respectively). Scale bars represent 100 μm. (vii) Evaporation mechanism of a colloidal droplet on a rough substrate (reproduced with permission from ref. [99]. Copyright 2018 Hindawi). (c) Phase diagram for a nano rough surface considering the effects of particle size, concentration, and substrate morphology (reproduced with permission from ref. [100]. Copyright 2020 Elsevier).
Figure 9
Figure 9
(a) Dried drops of blood (drop diameter: 5.9 mm) in (i) sample from a 27-year-old woman in good health, (ii) person with anemia, (iii) sample from a 31-year-old man in good health and (iv) person with hyperlipidemia (reproduced with permission from ref. [155]. Copyright 2010 Cambridge University Press). (b) Non-uniform deposition patterns in cDNA microarray (reproduced with permission from ref. [166]. Copyright 2002 American Chemical Society). (c) Photographs of patterns on a PET film after evaporation of drops of mixtures of acid red 1 (upper) and acid blue 25 (lower) solutions with 0 mM (left) and 16.0 mM (right) NaCl, respectively (reproduced with permission from ref. [67]. Copyright 2020 Chinese Physical Society and IOP Publishing Ltd.).

Similar articles

Cited by

References

    1. Liu S., Zhang X., Yin M., Feng H., Zhang J., Zhang L., Xie W. Coffee-ring-free ultrasonic spray coating single-emission layers for white organic light-emitting devices and their energy-transfer mechanism. ACS Appl. Energy Mater. 2017;1:103–112. doi: 10.1021/acsaem.7b00011. - DOI
    1. Deng Y., Wang Q., Yuan Y., Huang J. Vividly colorful hybrid perovskite solar cells by doctor-blade coating with perovskite photonic nanostructures. Mater. Horiz. 2015;2:578–583. doi: 10.1039/C5MH00126A. - DOI
    1. Jiang C., Ng S.M., Leung C.W., Pong P.W. Magnetically assembled iron oxide nanoparticle coatings and their integration with pseudo-spin-valve thin films. J. Mater. Chem. C. 2017;5:252–263. doi: 10.1039/C6TC03918A. - DOI
    1. Tiara A., Moon H., Cho G., Lee J. Fully roll-to-roll gravure printed electronics: Challenges and the way to integrating logic gates. Jpn. J. Appl. Phys. 2022;61:SE0802. doi: 10.35848/1347-4065/ac575e. - DOI
    1. He P., Derby B. Controlling coffee ring formation during drying of inkjet printed 2D inks. Adv. Mater. Interfaces. 2017;4:1700944. doi: 10.1002/admi.201700944. - DOI

LinkOut - more resources