

High Sensitivity Monitoring of VOCs in Air through FTIR Spectroscopy Using a Multipass Gas Cell Setup
- PMID: 35957181
- PMCID: PMC9370991
- DOI: 10.3390/s22155624
High Sensitivity Monitoring of VOCs in Air through FTIR Spectroscopy Using a Multipass Gas Cell Setup
Abstract
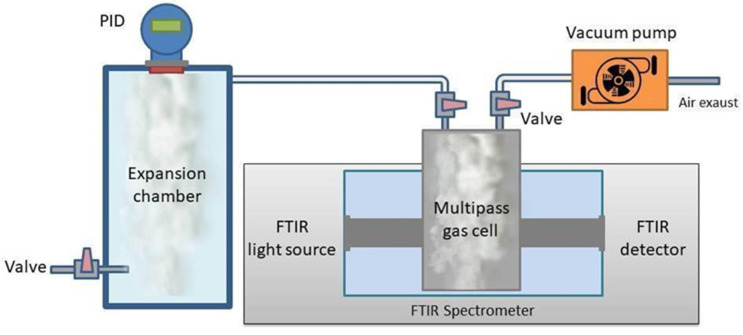
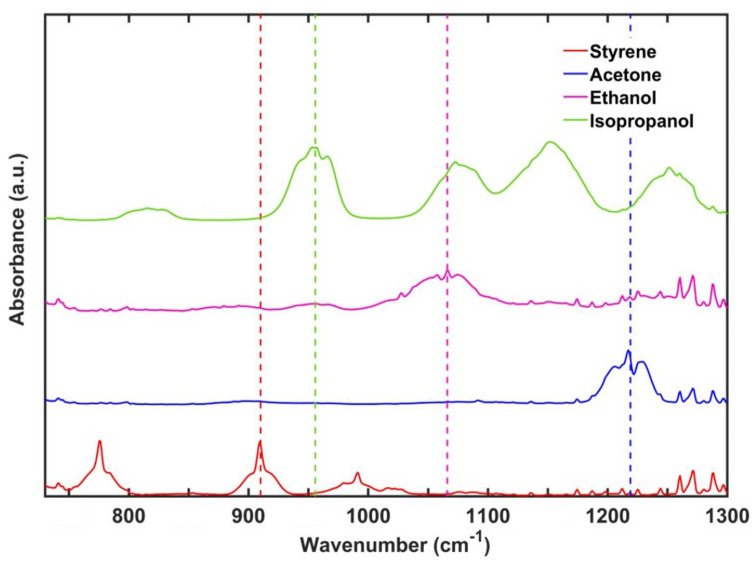
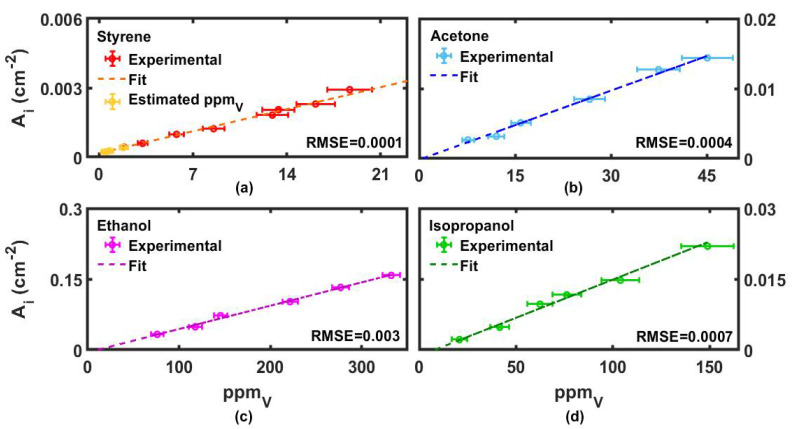
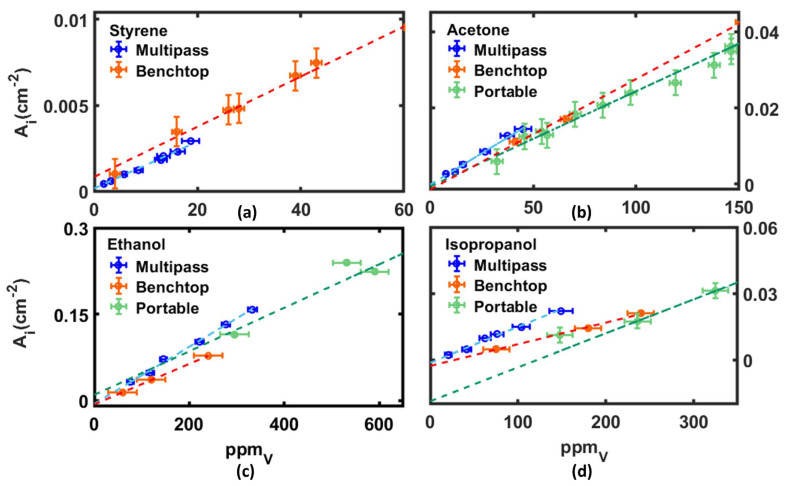
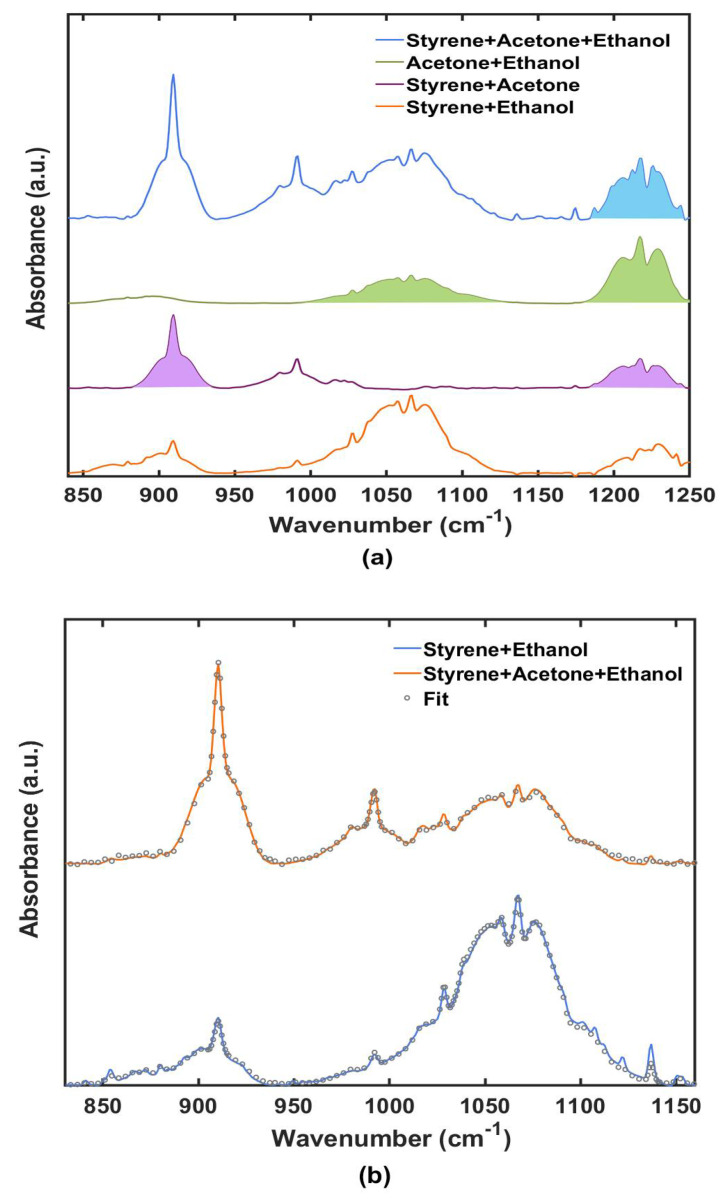
Human exposure to Volatile Organic Compounds (VOCs) and their presence in indoor and working environments is recognized as a serious health risk, causing impairments of varying severities. Different detecting systems able to monitor VOCs are available in the market; however, they have significant limitations for both sensitivity and chemical discrimination capability. During the last years we studied systematically the use of Fourier Transform Infrared (FTIR) spectroscopy as an alternative, powerful tool for quantifying VOCs in air. We calibrated the method for a set of compounds (styrene, acetone, ethanol and isopropanol) by using both laboratory and portable infrared spectrometers. The aim was to develop a new, and highly sensitive sensor system for VOCs monitoring. In this paper, we improved the setup performance, testing the feasibility of using a multipass cell with the aim of extending the sensitivity of our system down to the part per million (ppm) level. Considering that multipass cells are now also available for portable instruments, this study opens the road for the design of new high-resolution devices for environmental monitoring.
Keywords: FTIR; VOCs; accuracy; acetone; ethanol; isopropanol; ppmv; sensor; styrene.
Conflict of interest statement
The authors declare no conflict of interest.
Figures
Similar articles
-
Real-time quantitative detection of styrene in atmosphere in presence of other volatile-organic compounds using a portable device.Talanta. 2021 Oct 1;233:122510. doi: 10.1016/j.talanta.2021.122510. Epub 2021 May 12. Talanta. 2021. PMID: 34215125
-
Volatile organic compounds (VOCs) in indoor air and tap water samples in residences of pregnant women living in an area of unconventional natural gas operations: Findings from the EXPERIVA study.Sci Total Environ. 2022 Jan 20;805:150242. doi: 10.1016/j.scitotenv.2021.150242. Epub 2021 Sep 14. Sci Total Environ. 2022. PMID: 34818775
-
Profiles and monthly variations of selected volatile organic compounds in indoor air in Canadian homes: Results of Canadian national indoor air survey 2012-2013.Environ Int. 2019 May;126:134-144. doi: 10.1016/j.envint.2019.02.035. Epub 2019 Feb 21. Environ Int. 2019. PMID: 30798194
-
An overview of health hazards of volatile organic compounds regulated as indoor air pollutants.Rev Environ Health. 2019 Mar 26;34(1):81-89. doi: 10.1515/reveh-2018-0046. Rev Environ Health. 2019. PMID: 30854833 Review.
-
Volatile Organic Compounds (VOCs) as Environmental Pollutants: Occurrence and Mitigation Using Nanomaterials.Int J Environ Res Public Health. 2021 Dec 13;18(24):13147. doi: 10.3390/ijerph182413147. Int J Environ Res Public Health. 2021. PMID: 34948756 Free PMC article. Review.
Cited by
-
Studying SARS-CoV-2 ssRNA key sequence combining Fourier transform infrared spectroscopy and theoretical folding model.Eur Biophys J. 2025 Jun 12. doi: 10.1007/s00249-025-01766-8. Online ahead of print. Eur Biophys J. 2025. PMID: 40504245
-
ZIF-8-Based Surface Plasmon Resonance and Fabry-Pérot Sensors for Volatile Organic Compounds.Sensors (Basel). 2024 Jul 5;24(13):4381. doi: 10.3390/s24134381. Sensors (Basel). 2024. PMID: 39001159 Free PMC article.
-
Integrated Optics Waveguides and Mesoporous Oxides for the Monitoring of Volatile Organic Compound Traces in the Mid-Infrared.Appl Spectrosc. 2025 May;79(5):842-851. doi: 10.1177/00037028241300554. Epub 2024 Dec 18. Appl Spectrosc. 2025. PMID: 39692077 Free PMC article.
-
Towards Optoelectronic Technology: From Basic Research to Applications.Sensors (Basel). 2025 Mar 27;25(7):2116. doi: 10.3390/s25072116. Sensors (Basel). 2025. PMID: 40218627 Free PMC article.
-
A Review of Biogenic Volatile Organic Compounds from Plants: Research Progress and Future Prospects.Toxics. 2025 Apr 30;13(5):364. doi: 10.3390/toxics13050364. Toxics. 2025. PMID: 40423443 Free PMC article. Review.
References
-
- McDonald C., de Gouw J.A., Gilman J.B., Jathar S.H., Akherati A., Cappa C.D., Jimenez J.L., Lee-Taylor J., Hayes P.L., McKeen S.A., et al. Volatile chemical products emerging as largest petrochemical source of urban organic emissions. Science. 2018;359:760–764. doi: 10.1126/science.aaq0524. - DOI - PubMed
-
- Rizk M., Guo F.F., Verriele M., Ward M., Dusanter S., Blond N., Locoge N., Schoemaecker C. Impact of material emissions and sorption of volatile organic compounds on indoor air quality in a low energy building: Field measurements and modeling. Indoor Air. 2018;28:924–935. doi: 10.1111/ina.12493. - DOI - PubMed
-
- Gozzi F., Della Ventura G., Marcelli A. Mobile monitoring of particulate matter: State of art and perspectives. Atmospheric Pollut. Res. 2016;7:228–234. doi: 10.1016/j.apr.2015.09.007. - DOI
MeSH terms
Substances
LinkOut - more resources
Full Text Sources
Medical
