

Mild pentachlorophenol-mediated uncoupling of mitochondria depletes ATP but does not cause an oxidized redox state or dopaminergic neurodegeneration in Caenorhabditis elegans
- PMID: 35957653
- PMCID: PMC9361317
- DOI: 10.1016/j.crtox.2022.100084
Mild pentachlorophenol-mediated uncoupling of mitochondria depletes ATP but does not cause an oxidized redox state or dopaminergic neurodegeneration in Caenorhabditis elegans
Abstract
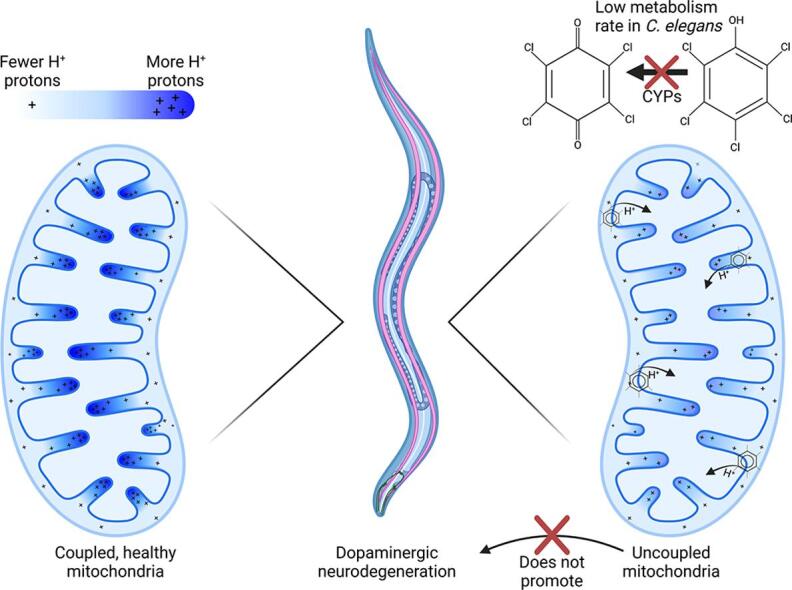
Aims: Mitochondrial dysfunction is implicated in several diseases, including neurological disorders such as Parkinson's disease. However, there is uncertainty about which of the many mechanisms by which mitochondrial function can be disrupted may lead to neurodegeneration. Pentachlorophenol (PCP) is an organic pollutant reported to cause mitochondrial dysfunction including oxidative stress and mitochondrial uncoupling. We investigated the effects of PCP exposure in Caenorhabditis elegans, including effects on mitochondria and dopaminergic neurons. We hypothesized that mild mitochondrial uncoupling by PCP would impair bioenergetics while decreasing oxidative stress, and therefore would not cause dopaminergic neurodegeneration.
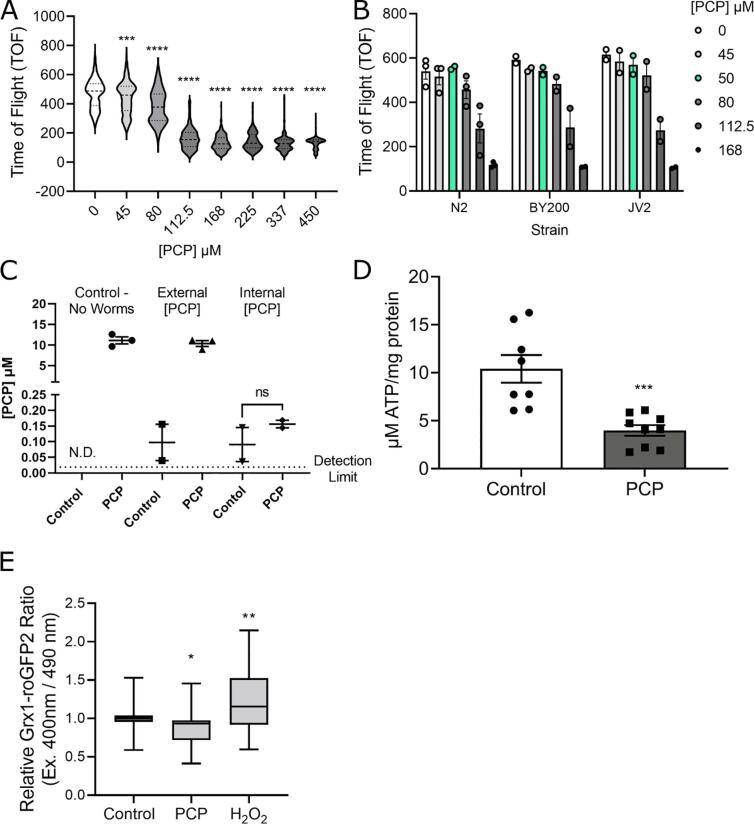
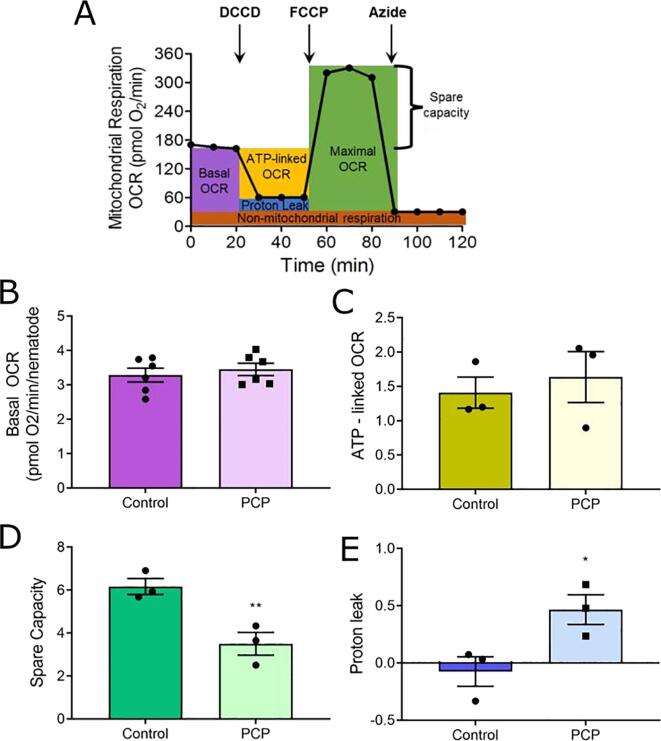
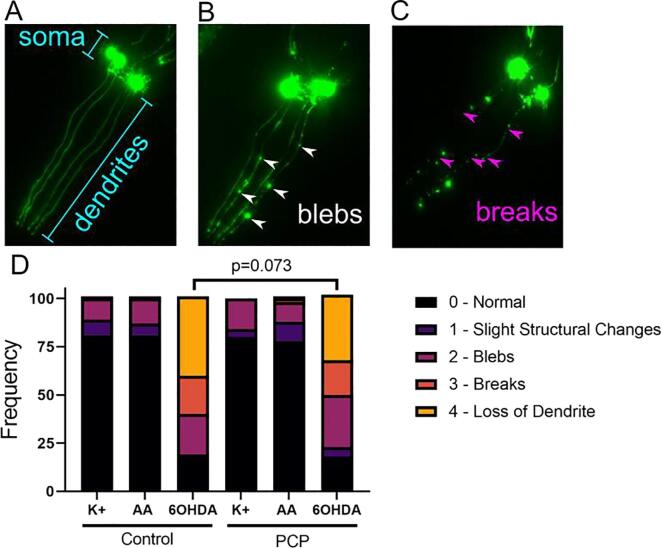
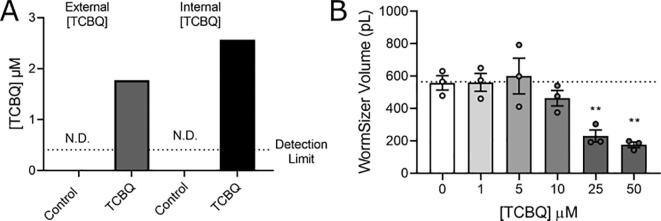
Results: A 48-hour developmental exposure to PCP causing mild growth delay (∼10 % decrease in growth during 48 h, covering all larval stages) reduced whole-organism ATP content > 50 %, and spare respiratory capacity ∼ 30 %. Proton leak was also markedly increased. These findings suggest a main toxic mechanism of mitochondrial uncoupling rather than oxidative stress, which was further supported by a concomitant shift toward a more reduced cellular redox state measured at the whole organism level. However, exposure to PCP did not cause dopaminergic neurodegeneration, nor did it sensitize animals to a neurotoxic challenge with 6-hydroxydopamine. Whole-organism uptake and PCP metabolism measurements revealed low overall uptake of PCP in our experimental conditions (50 μM PCP in the liquid exposure medium resulted in organismal concentrations of < 0.25 μM), and no measurable production of the oxidative metabolites tetra-1,4-benzoquinone and tetrachloro-p-hydroquinone.
Innovation: This study provides new insights into the mechanistic interplay between mitochondrial uncoupling, oxidative stress, and neurodegeneration in C. elegans. These findings support the premise of mild uncoupling-mediated neuroprotection, but are inconsistent with proposed broad "mitochondrial dysfunction"-mediated neurodegeneration models, and highlight the utility of the C. elegans model for studying mitochondrial and neurotoxicity.
Conclusions: Developmental exposure to pentachlorophenol causes gross toxicological effects (growth delay and arrest) at high levels. At a lower level of exposure, still causing mild growth delay, we observed mitochondrial dysfunction including uncoupling and decreased ATP levels. However, this was associated with a more-reduced cellular redox tone and did not exacerbate dopaminergic neurotoxicity of 6-hydroxydopamine, instead trending toward protection. These findings may be informative of efforts to define nuanced mitochondrial dysfunction-related adverse outcome pathways that will differ depending on the form of initial mitochondrial toxicity.
Keywords: Adverse outcome pathway; Caenorhabditis elegans; Dopaminergic neurodegeneration; Mitochondrial uncoupling; Redox tone.
© 2022 The Author(s).
Conflict of interest statement
The authors declare that they have no known competing financial interests or personal relationships that could have appeared to influence the work reported in this paper.
Figures
Similar articles
-
Mitochondrial dysfunction, oxidative stress, and neurodegeneration elicited by a bacterial metabolite in a C. elegans Parkinson's model.Cell Death Dis. 2014 Jan 9;5(1):e984. doi: 10.1038/cddis.2013.513. Cell Death Dis. 2014. PMID: 24407237 Free PMC article.
-
Dysregulation of the Mitochondrial Unfolded Protein Response Induces Non-Apoptotic Dopaminergic Neurodegeneration in C. elegans Models of Parkinson's Disease.J Neurosci. 2017 Nov 15;37(46):11085-11100. doi: 10.1523/JNEUROSCI.1294-17.2017. Epub 2017 Oct 13. J Neurosci. 2017. PMID: 29030433 Free PMC article.
-
Zearalenone Induces Dopaminergic Neurodegeneration via DRP-1-Involved Mitochondrial Fragmentation and Apoptosis in a Caenorhabditis elegans Parkinson's Disease Model.J Agric Food Chem. 2021 Oct 13;69(40):12030-12038. doi: 10.1021/acs.jafc.1c05836. Epub 2021 Sep 29. J Agric Food Chem. 2021. PMID: 34586801
-
Exploring Caenorhabditis elegans as Parkinson's Disease Model: Neurotoxins and Genetic Implications.Neurotox Res. 2024 Feb 6;42(1):11. doi: 10.1007/s12640-024-00686-3. Neurotox Res. 2024. PMID: 38319410 Review.
-
Mitochondrial bioenergetics and disease in Caenorhabditis elegans.Front Biosci (Landmark Ed). 2015 Jan 1;20(2):198-228. doi: 10.2741/4305. Front Biosci (Landmark Ed). 2015. PMID: 25553447 Review.
Cited by
-
Complex I superoxide anion production is necessary and sufficient for complex I inhibitor-induced dopaminergic neurodegeneration in Caenorhabditis elegans.Redox Biol. 2025 Apr;81:103538. doi: 10.1016/j.redox.2025.103538. Epub 2025 Feb 8. Redox Biol. 2025. PMID: 39952197 Free PMC article.
References
-
- Albrecht S.C., Barata A.G., Großhans J., Teleman A.A., Dick T.P. In Vivo Mapping of Hydrogen Peroxide and Oxidized Glutathione Reveals Chemical and Regional Specificity of Redox Homeostasis: Cell Metabolism. Cell Metab. 2011;14:819–829. - PubMed
-
- Albrecht S.C., Barata A.G., Grosshans J., Teleman A.A., Dick T.P. In vivo mapping of hydrogen peroxide and oxidized glutathione reveals chemical and regional specificity of redox homeostasis. Cell Metab. 2011;14:19–829. - PubMed
-
- ATSDR. 2017. The ATSDR 2019 Substance Priority List. https://www.atsdr.cdc.gov/spl/index.html#2019spl.
-
- ATSDR. 2022. Toxicological profile for pentachlorophenol. https://www.atsdr.cdc.gov/toxprofiles/tp51.pdf. - PubMed
-
- Attene-Ramos M.S., Huang R., Sakamuru S., Witt K.L., Beeson G.C., Shou L., Schnellmann R.G., Beeson C.C., Tice R.R., Austin C.P., Xia M. Systematic study of mitochondrial toxicity of environmental chemicals using quantitative high throughput screening. Chem. Res. Toxicol. 2013;26:1323–1332. - PMC - PubMed
Grants and funding
LinkOut - more resources
Full Text Sources
