. 2022 May 17;4(2):65-75.
doi: 10.1097/BS9.0000000000000113. eCollection 2022 Apr.

Single-cell analysis of transcription factor regulatory networks reveals molecular basis for subtype-specific dysregulation in acute myeloid leukemia

Affiliations

Single-cell analysis of transcription factor regulatory networks reveals molecular basis for subtype-specific dysregulation in acute myeloid leukemia

Ruixia Sun et al. Blood Sci. .

Abstract

Highly heterogeneous acute myeloid leukemia (AML) exhibits dysregulated transcriptional programs. Transcription factor (TF) regulatory networks underlying AML subtypes have not been elucidated at single-cell resolution. Here, we comprehensively mapped malignancy-related TFs activated in different AML subtypes by analyzing single-cell RNA sequencing data from AMLs and healthy donors. We first identified six modules of regulatory networks which were prevalently dysregulated in all AML patients. AML subtypes featured with different malignant cellular composition possessed subtype-specific regulatory TFs associated with differentiation suppression or immune modulation. At last, we validated that ERF was crucial for the development of hematopoietic stem/progenitor cells by performing loss- and gain-of-function experiments in zebrafish embryos. Collectively, our work thoroughly documents an abnormal spectrum of transcriptional regulatory networks in AML and reveals subtype-specific dysregulation basis, which provides a prospective view to AML pathogenesis and potential targets for both diagnosis and therapy.

Keywords: Acute myeloid leukaemia; Co-expression analysis; Single-cell RNA-sequencing; Transcription factor; Transcriptional regulatory network.


Conflict of interest statement

The authors declare no conflicts of interest.

Figures

Figure 1
Figure 1
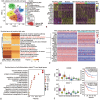
Differences of transcriptional regulatory networks between normal and malignant hematopoiesis based on scRNA-seq data. (A) Schematic overview of the scRNA-seq datasets and computational procedures used in this study. (B) t-SNE plot based on RAS of total normal and malignant hematopoietic cells. Cells were labeled by cell-type annotations from the reference. (C) Correlation analysis of regulons based on RAS of total AML and healthy donor datasets. GO and KEGG enrichment analysis of TFs in each module. Top one enriched term and related TFs were displayed. (D) Comparison of RAS between AML and corresponding normal cells of the 6 modules in (C) (P < .001, Wilcoxon test). (E) Transcriptional regulatory network (TRN) constructed by TFs and their targets in AML and corresponding normal cells. Circles indicate TFs; colors indicate cell clusters; dots around a circle mean target genes. (F) Heatmap of the RAS of tumor-specific TFs in AML cells and corresponding normal cells. AML = acute myeloid leukemia, B = mature B cell, cDC = conventional dendritic cell, CTL = cytotoxic T Lymphocyte, early Ery = early erythroid progenitor, GMP = granulocyte-macrophage progenitor, GO = gene ontology, HSC = hematopoietic stem cell, late Ery = late erythroid progenitor, Mono = monocyte, NK = natural killer cell, pDC = plasmacytoid dendritic cell, Plasma = plasma cell, Pro B = progenitor B cell, Prog = progenitor, ProMono = promonocyte, RAS =  regulon activity scores, T = naïve T cell.
Figure 2
Figure 2
AML subtype featured with malignant stem/progenitor cells exhibited cell differentiation related dysregulation. (A) t-SNE plot based on RAS in AML subtype (AML707B) featured with malignant stem and progenitor cells. Points are color-coded by cell-type annotations. t-SNE plot located on the lower right emphasizes the distribution of AML cells (colored in red). (B) Heatmap of differentially activated TFs in Prog-like/GMP-like population C2 and its corresponding normal population C3. (C) Enrichment analysis of differentially activated TFs in (B). Related signaling pathways and corresponding TFs are listed on the right. (D) Transcriptional activity of cell cycle and differentiation related genes in C2 and C3 using the gene sets generated from AmiGO corresponding to the GO terms marked in red in (C) (P < .001, Wilcoxon test). (E) Differentially activated TFs between C2 and C3. The colors represent logarithmic transformed adjusted P values (Benjamini-Hochberg correction). (F) High regulon activity scores of ERF in C2 cells. (G) TRN constructed by differentially activated TFs and their target genes in C2. Circles colored in orange indicate TFs; dots around a circle indicate target genes; dots colored in red represent highly expressed target genes; dots colored in blue mean target genes with low expression; dot sizes indicate the average log2(fold change); line thickness represents the regulatory weight score. The enlarged section of TRN located on the right illustrates that ERF, SOX4, and ZFHX2 co-regulate the target gene RUNX1T1. AML = acute myeloid leukemia, GO = gene ontology, RAS =  regulon activity scores, TF = transcription factor, TRN =  transcriptional regulatory network.
Figure 3
Figure 3
Transcriptional regulatory aberrations underline AML subtype with differentiated malignant cells. (A) t-SNE plot based on RAS in AML subtype (AML556) with differentiated malignant cells. Points are color-coded by cell-type annotations. t-SNE plot located on the lower right emphasized the distribution of AML cells (colored in red). (B) Trajectory analysis of Prog/GMP, ProMono/Mono, and ProMono-like/Mono-like cells based on gene expression. (C) Heatmap shows branch-dependent genes and unsupervised clustering of four kinetic modules with corresponding enrichment analysis. Related enriched GO terms and -log10q value were listed on the right. (D) Spectrum of ligand-receptor pairs (rows) between C1/C2 and T/CTL/NK cells C0 (columns). Dot sizes represent logarithmic transformed P values (permutation test) and dot colors mean the expression of interacting molecules in corresponding cell subsets. (E) Volcano plot shows the differentially activated TFs in C1 (dots colored in blue) and C2 (dots colored in red). (F) TRN constructed by differentially activated TFs in C2 and target genes enriched in immune-related GO terms in (E). Circles colored in orange represent TFs; dots colored in purple around a circle indicate target genes; circle sizes indicate the number of regulated targeted genes; line thickness represents the regulatory weight scores. AML = acute myeloid leukemia, GO = gene ontology, RAS =  regulon activity scores, TF = transcription factor, TRN =  transcriptional regulatory network.
Figure 4
Figure 4
Aberrant regulation and cell differentiation of primitive malignant cells in AML subtype with multiple cell types. (A) t-SNE plot based on RAS of AML subtype (AML921A) with multiple malignant cell types along the HSC to myeloid axis. Points are color-coded by cell-type annotations. t-SNE plot located on the lower right emphasized the distribution of AML cells (colored in red). (B) Heatmaps show RAS of normal TF signatures for HSC/Prog, GMP, and differentiated myeloid cells in normal cells (left) and malignant AML cells (right). (C) GO and KEGG pathway analysis of highly activated TFs of primitive malignant cells in AML921A and AML707B. Color shows the -log10(q value). (D) Heatmap shows the RAS of TFs related to the signaling pathways marked in red from (C) in the primitive malignant cells of AML921A and AML707. (E) Enrichment analysis of cell differentiation related TFs and their targets. Dot sizes represent number of genes enriched in each GO term and dot colors represent logarithmic transformed adjusted P values (Benjamini-Hochberg correction). (F) RAS of HOXB6 and NKX2-1 in all AML921A cell clusters (left) and their overall survival curves (right). AML = acute myeloid leukemia, GO = gene ontology, RAS =  regulon activity scores, TF = transcription factor.
Figure 5
Figure 5
Functional validation of ERF in stem/progenitor cells. (A) Expression of runx1 and cmyb in control and erf morphants at 36 hpf and 2 dpf, respectively. Black arrowheads denote runx1 and cmyb expression in AGM region. Scale bar, 100 μm. (B) qPCR analysis of runx1 and cmyb in control and erf morphants at 36 hpf. The expression level of runx1 and cmyb were normalized to β-actin (mean ± SD, Student t test; n = 3; ∗∗P < .01, ∗∗∗∗P < .0001). (C) Confocal microscopy of Tg(kdrl:mCherry/cmyb:EGFP) transgenic line at 36 hpf in control and erf morphants (upper panel). White arrowheads mark the hemogenic endothelial cells. The bottom panel showing quantification of kdrl+ cmyb+ cells in AGM region of control and erf morphants at 36 hpf (mean ± SD, Student t test, n = 12, ∗∗∗∗P < .0001). Scale bar, 50 μm. (D) Visualization of cmyb+ cells in CHT region of control and erf morphants at 50 hpf (upper panel) with quantification (bottom panel) (mean ± SD, Student t test, n = 10, ∗∗∗∗P < .0001). White arrowheads mark HSPCs. Scale bar, 50 μm.

Similar articles

Cited by

References

    1. Shah A, Andersson TM, Rachet B, Bjorkholm M, Lambert PC. Survival and cure of acute myeloid leukaemia in England, 1971–2006: a population-based study. Br J Haematol 2013;162 (4):509–516. doi:10.1111/bjh.12425. - PubMed
    1. De Kouchkovsky I, Abdul-Hay M. Acute myeloid leukemia: a comprehensive review and 2016 update. Blood Cancer J 2016;6 (7):e441. doi:10.1038/bcj.2016.50. - PMC - PubMed
    1. Li S, Mason CE, Melnick A. Genetic and epigenetic heterogeneity in acute myeloid leukemia. Curr Opin Genet Dev 2016;36:100–106. doi:10.1016/j.gde.2016.03.011. - PMC - PubMed
    1. Stavast CJ, Leenen PJM, Erkeland SJ. The interplay between critical transcription factors and microRNAs in the control of normal and malignant myelopoiesis. Cancer Lett 2018;427:28–37. doi:10.1016/j.canlet.2018.04.010. - PubMed
    1. Iwasaki H, Mizuno S, Arinobu Y, et al. . The order of expression of transcription factors directs hierarchical specification of hematopoietic lineages. Genes Dev 2006;20 (21):3010–3021. doi:10.1101/gad.1493506. - PMC - PubMed

LinkOut - more resources