

Molecular investigation of candidate genes for pyroptosis-induced inflammation in diabetic retinopathy
- PMID: 35957838
- PMCID: PMC9357938
- DOI: 10.3389/fendo.2022.918605
Molecular investigation of candidate genes for pyroptosis-induced inflammation in diabetic retinopathy
Abstract
Background: Diabetic retinopathy is a diabetic microvascular complication. Pyroptosis, as a way of inflammatory death, plays an important role in the occurrence and development of diabetic retinopathy, but its underlying mechanism has not been fully elucidated. The purpose of this study is to identify the potential pyroptosis-related genes in diabetic retinopathy by bioinformatics analysis and validation in a diabetic retinopathy model and predict the microRNAs (miRNAs) and long non-coding RNAs (lncRNAs) interacting with them. Subsequently, the competing endogenous RNA (ceRNA) regulatory network is structured to explore their potential molecular mechanism.
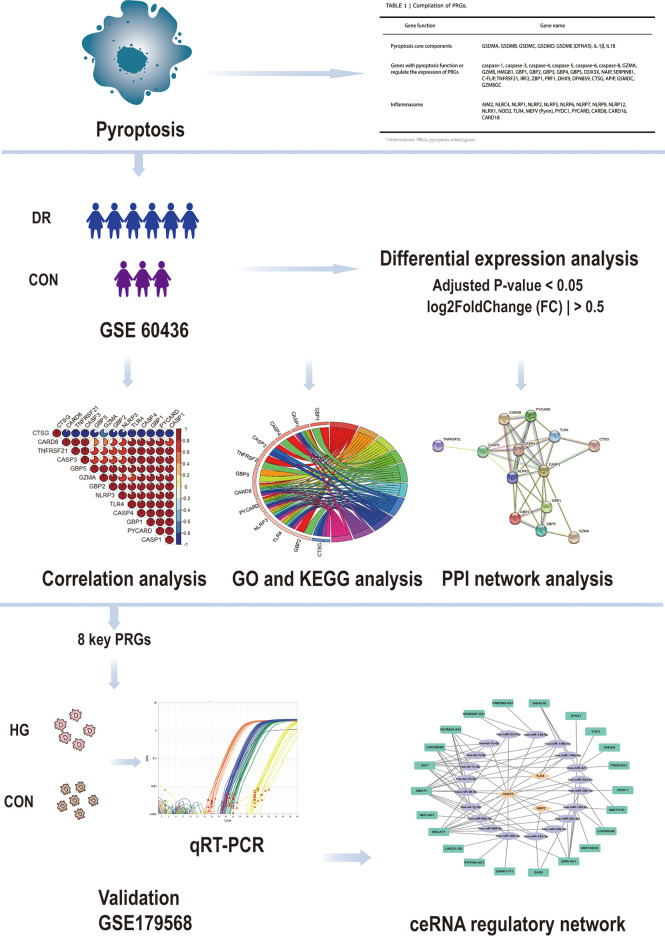
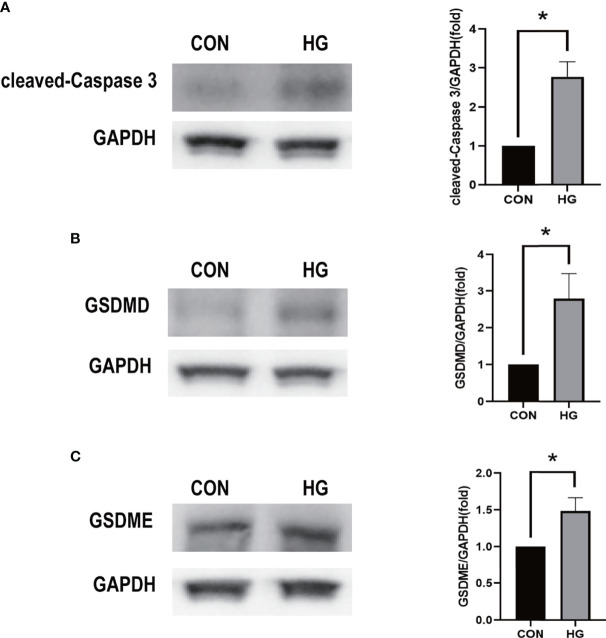
Methods: We obtained mRNA expression profile dataset GSE60436 from the Gene Expression Omnibus (GEO) database and collected 51 pyroptosis-related genes from the PubMmed database. The differentially expressed pyroptosis-related genes were obtained by bioinformatics analysis with R software, and then eight key genes of interest were identified by correlation analysis, Gene Ontology (GO) enrichment analysis, Kyoto Encyclopedia of Genes and Genomes (KEGG) pathway analysis, and protein-protein interaction (PPI) network analysis. Then, the expression levels of these key pyroptosis-related genes were validated with quantitative real-time polymerase chain reaction (qRT-PCR) in human retinal endothelial cells with high glucose incubation, which was used as an in vitro model of diabetic retinopathy. Western blot was performed to measure the protein levels of gasdermin D (GSDMD), dasdermin E (GSDME) and cleaved caspase-3 in the cells. Moreover, the aforementioned genes were further confirmed with the validation set. Finally, the ceRNA regulatory network was structured, and the miRNAs and lncRNAs which interacted with CASP3, TLR4, and GBP2 were predicted.
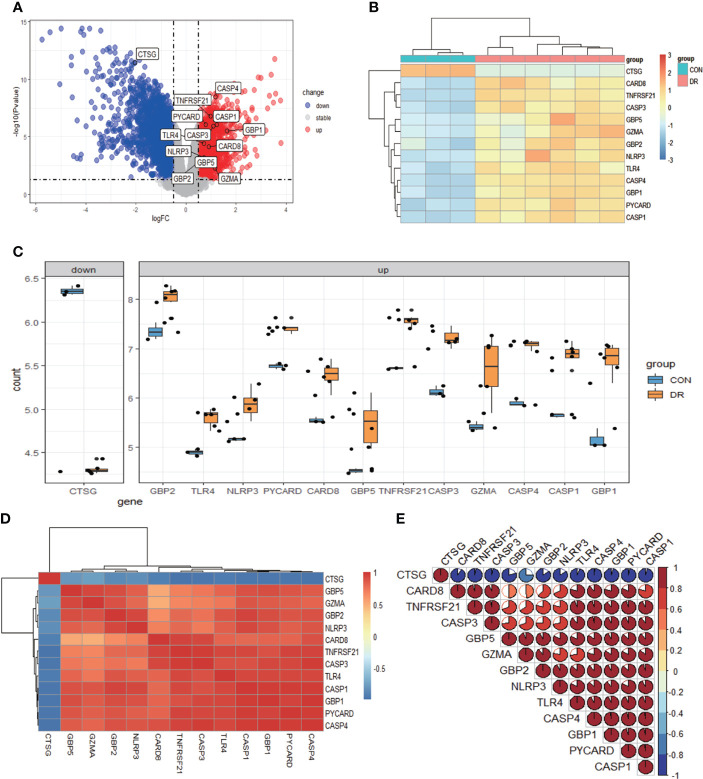
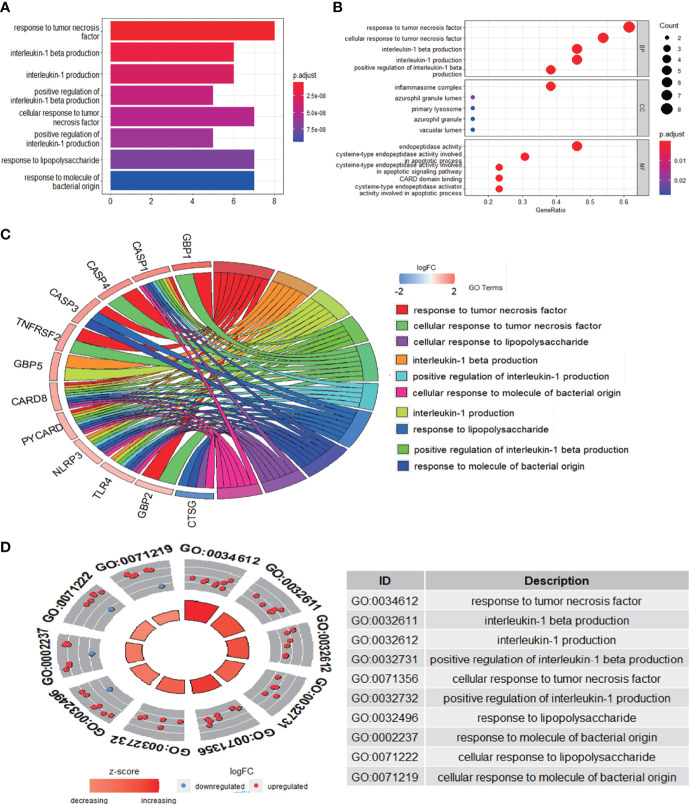
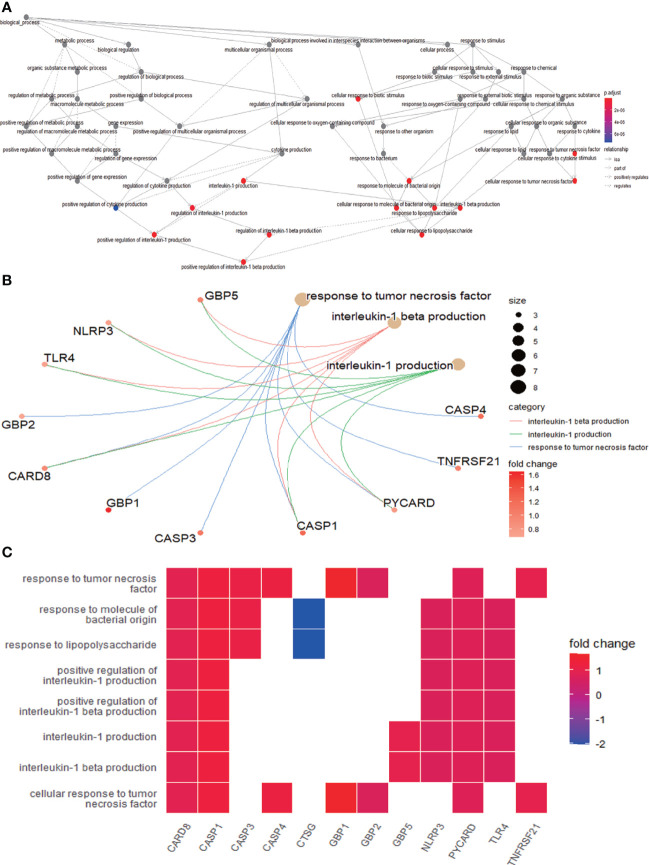
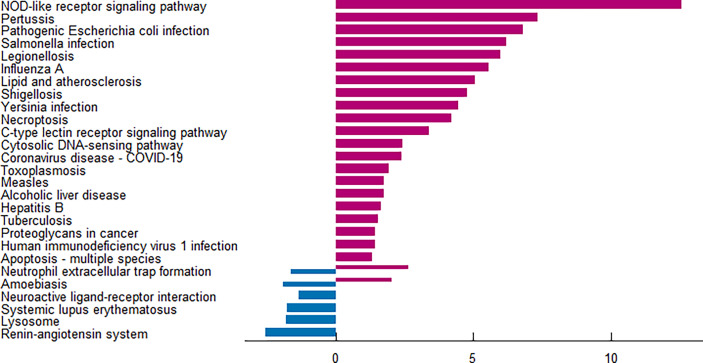
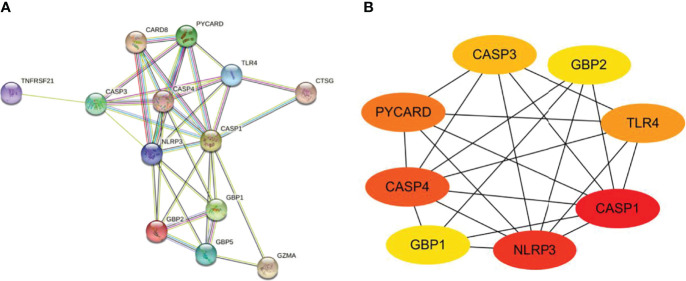
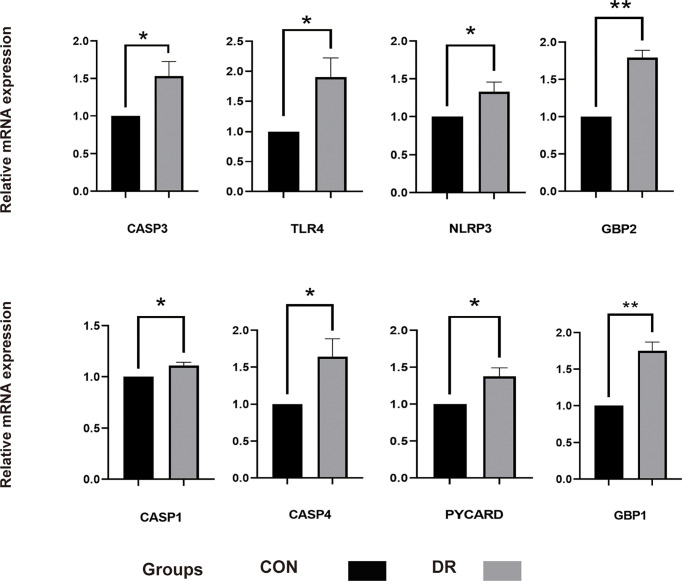
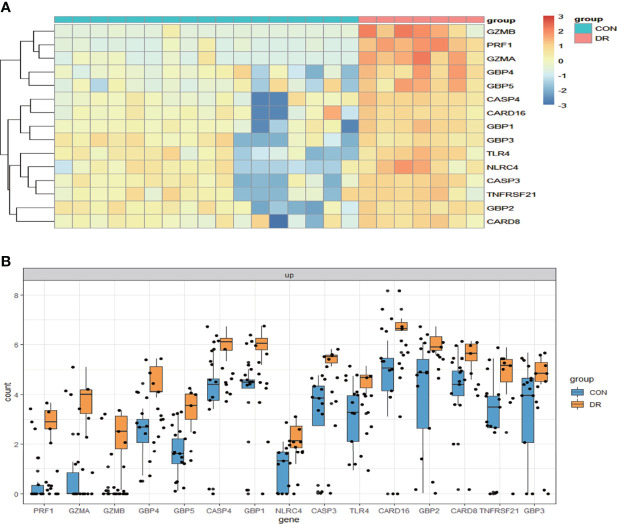
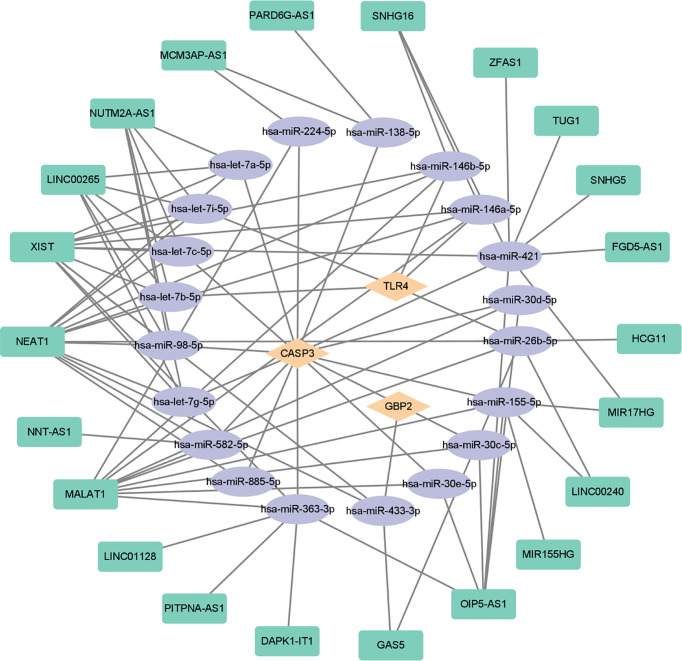
Results: A total of 13 differentially expressed pyroptosis-related genes were screened from six proliferative diabetic retinopathy patients and three RNA samples from human retinas, including one downregulated gene and 12 upregulated genes. A correlation analysis showed that there was a correlation among these genes. Then, KEGG pathway and GO enrichment analyses were performed to explore the functional roles of these genes. The results showed that the mRNA of these genes was mainly related to inflammasome complex, interleukin-1 beta production, and NOD-like receptor signaling pathway. In addition, eight hub genes-CASP3, TLR4, NLRP3, GBP2, CASP1, CASP4, PYCARD, and GBP1-were identified by PPI network analysis using Cytoscape software. High glucose increased the protein level of GSDMD and GSDME, as critical effectors of pyroptosis, in retinal vascular endothelial cells. Verified by qRT-PCR, the expression of all these eight hub genes in the in vitro model of diabetic retinopathy was consistent with the results of the bioinformatics analysis of mRNA chip. Among them, CASP4, GBP1, CASP3, TLR4, and GBP2 were further validated in the GSE179568 dataset. Finally, 20 miRNAs were predicted to target three key genes-CASP3, GBP2, and TLR4, and 22 lncRNAs were predicted to potentially bind to these 20 miRNAs. Then, we constructed a key ceRNA network that is expected to mediate cellular pyroptosis in diabetic retinopathy.
Conclusion: Through the data analysis of the GEO database by R software and verification by qRT-PCR and validation set, we successfully identified potential pyroptosis-related genes involved in the occurrence of diabetic retinopathy. The key ceRNA regulatory network associated with these genes was structured. These findings might improve the understanding of molecular mechanisms underlying pyroptosis in diabetic retinopathy.
Keywords: competing endogenous RNA regulatory network; diabetic retinopathy; expression profiling by array; inflammatory death; pyroptosis.
Copyright © 2022 Wang, Ding, Liu, Zhang, Zheng, Xia and Xiong.
Conflict of interest statement
The authors declare that the research was conducted in the absence of any commercial or financial relationships that could be construed as a potential conflict of interest.
Figures
Similar articles
-
Identifying pyroptosis- and inflammation-related genes in spinal cord injury based on bioinformatics analysis.Sci Rep. 2025 Jul 14;15(1):25424. doi: 10.1038/s41598-025-10541-w. Sci Rep. 2025. PMID: 40659785 Free PMC article.
-
Bioinformatics analysis and validation of novel biomarkers and competitive endogenous RNA networks involved in pyroptosis in diabetic nephropathy.Sci Rep. 2025 Feb 14;15(1):5530. doi: 10.1038/s41598-025-87854-3. Sci Rep. 2025. PMID: 39953123 Free PMC article.
-
Construction of a Competitive Endogenous RNA Network Related to Exosomes in Diabetic Retinopathy.Comb Chem High Throughput Screen. 2023;26(3):576-588. doi: 10.2174/1386207325666220610122114. Comb Chem High Throughput Screen. 2023. PMID: 35692142
-
Bioinformatics analysis of ceRNA network of autophagy-related genes in pediatric asthma.Medicine (Baltimore). 2023 Dec 1;102(48):e36343. doi: 10.1097/MD.0000000000036343. Medicine (Baltimore). 2023. PMID: 38050261 Free PMC article. Review.
-
Comprehensive analysis of m6A modification lncRNAs in high glucose and TNF-α induced human umbilical vein endothelial cells.Medicine (Baltimore). 2023 Mar 10;102(10):e33133. doi: 10.1097/MD.0000000000033133. Medicine (Baltimore). 2023. PMID: 36897718 Free PMC article.
Cited by
-
RBM15 promotes m6A methylation and stability of KLF6 mRNA to accelerate pyroptosis of retinal ganglion cells in early-stage diabetic retinopathy.J Mol Histol. 2025 Jun 4;56(3):183. doi: 10.1007/s10735-025-10458-8. J Mol Histol. 2025. PMID: 40464812
-
Role of MicroRNA in linking diabetic retinal neurodegeneration and vascular degeneration.Front Endocrinol (Lausanne). 2024 Jul 4;15:1412138. doi: 10.3389/fendo.2024.1412138. eCollection 2024. Front Endocrinol (Lausanne). 2024. PMID: 39027475 Free PMC article. Review.
-
Analysis of shared ceRNA networks and related-hub genes in rats with primary and secondary photoreceptor degeneration.Front Neurosci. 2023 Sep 21;17:1259622. doi: 10.3389/fnins.2023.1259622. eCollection 2023. Front Neurosci. 2023. PMID: 37811327 Free PMC article.
-
Identification of Key Nucleotide Metabolism Genes in Diabetic Retinopathy Based on Bioinformatics Analysis and Experimental Verification.Biology (Basel). 2025 Apr 12;14(4):409. doi: 10.3390/biology14040409. Biology (Basel). 2025. PMID: 40282274 Free PMC article.
-
Identification of immune-related endoplasmic reticulum stress genes in proliferative diabetic retinopathy using bioinformatics analysis.Front Endocrinol (Lausanne). 2024 Aug 30;15:1341206. doi: 10.3389/fendo.2024.1341206. eCollection 2024. Front Endocrinol (Lausanne). 2024. PMID: 39280014 Free PMC article.
References
-
- Wang CF, Yuan JR, Qin D, Gu JF, Zhao BJ, Zhang L, et al. . Protection of tauroursodeoxycholic acid on high glucose-induced human retinal microvascular endothelial cells dysfunction and streptozotocin-induced diabetic retinopathy rats. J Ethnopharmacol (2016) 185:162–70. doi: 10.1016/j.jep.2016.03.026 - DOI - PubMed
Publication types
MeSH terms
Substances
LinkOut - more resources
Full Text Sources
Medical
Research Materials
Miscellaneous