. 2022 Jul 26:12:785345.
doi: 10.3389/fonc.2022.785345. eCollection 2022.

Paeoniflorin Inhibits EMT and Angiogenesis in Human Glioblastoma via K63-Linked C-Met Polyubiquitination-Dependent Autophagic Degradation

Affiliations

Paeoniflorin Inhibits EMT and Angiogenesis in Human Glioblastoma via K63-Linked C-Met Polyubiquitination-Dependent Autophagic Degradation

Zhi Liu et al. Front Oncol. .

Abstract

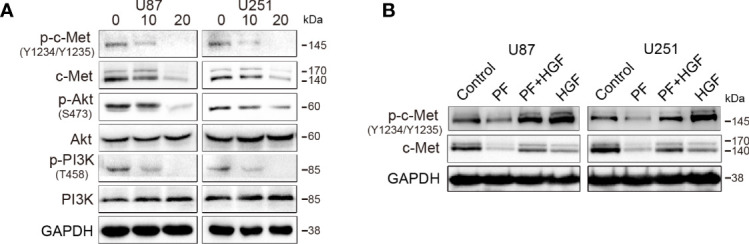
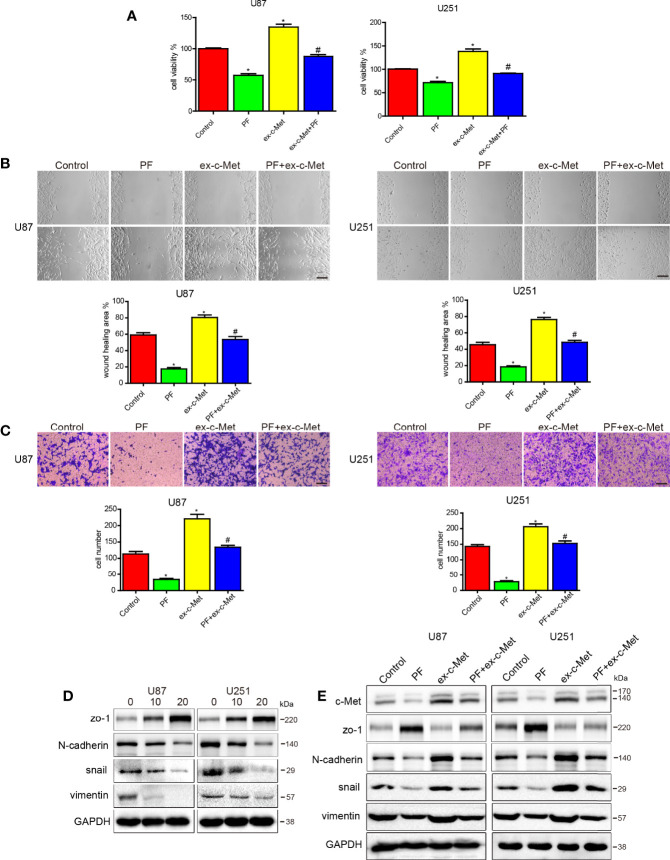
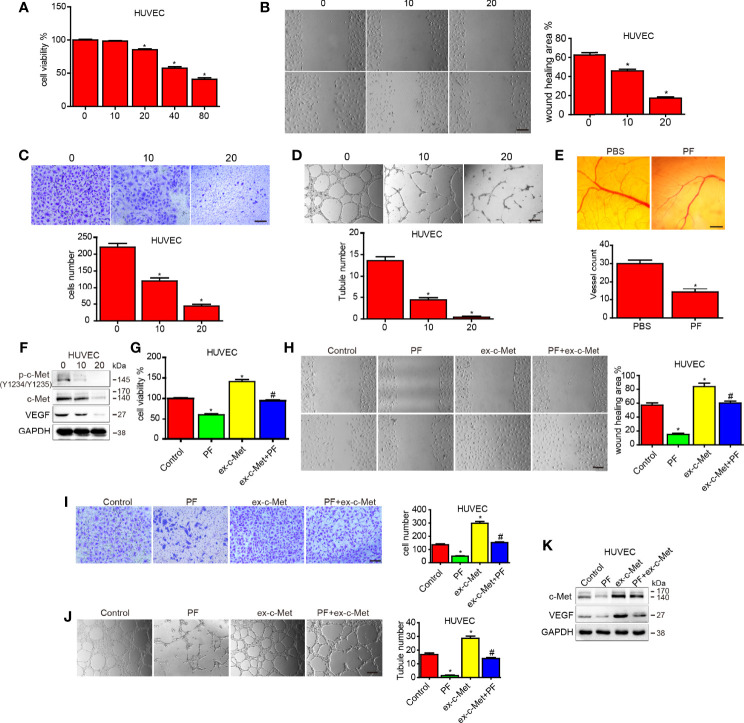
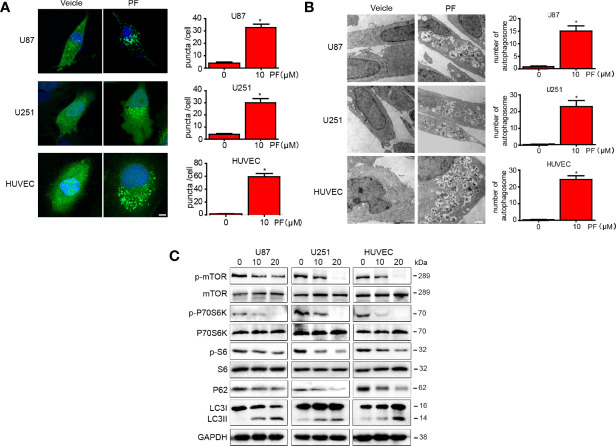
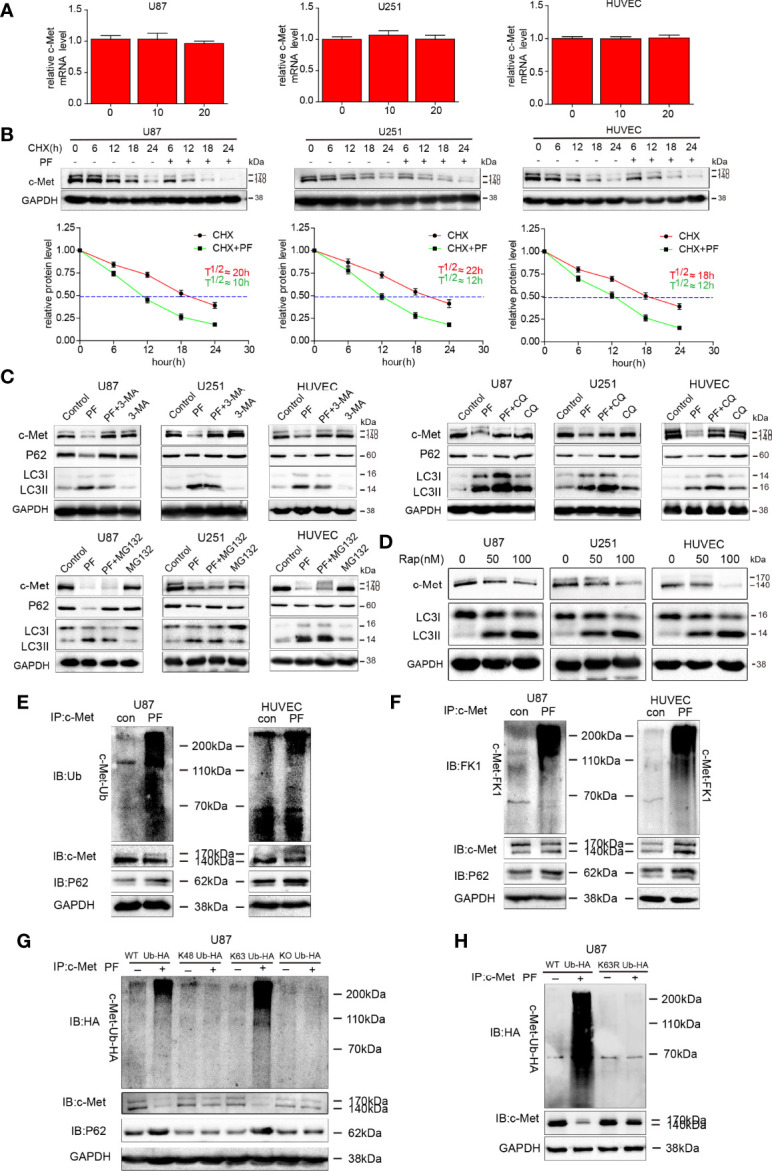
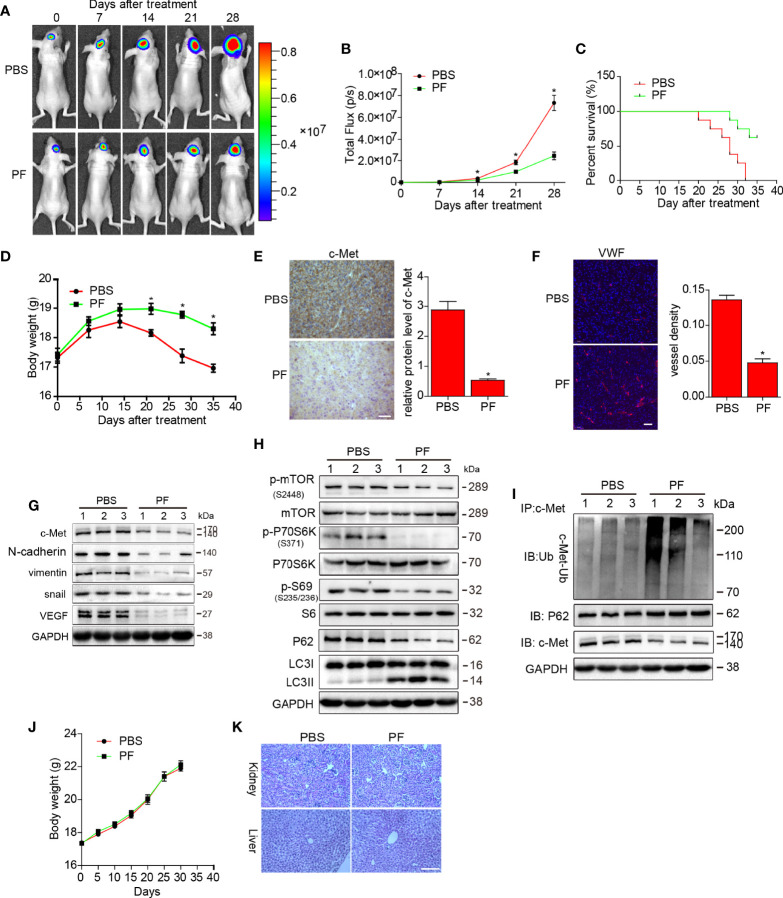
Epithelial-to-mesenchymal transition (EMT) and angiogenesis have emerged as two pivotal events in cancer progression. Paeoniflorin has been widely studied in experimental models and clinical trials for cancer treatment because of its anti-cancer property. However, the underlying mechanisms of paeoniflorin in EMT and angiogenesis in glioblastoma was not fully elucidated. The present study aimed to investigate whether paeoniflorin inhibits EMT and angiogenesis, which involving c-Met suppression, while exploring the potential ways of c-Met degradation. In our study, we found that paeoniflorin inhibited EMT via downregulating c-Met signaling in glioblastoma cells. Furthermore, overexpressing c-Met in glioblastoma cells abolished the effects of paeoniflorin on EMT. Moreover, paeoniflorin showed anti-angiogenic effects by suppressing cell proliferation, migration, invasion and tube formation through downregulating c-Met in human umbilical vein endothelial cells (HUVECs). And c-Met overexpression in HUVECs offset the effects of paeoniflorin on angiogenesis. Additionally, paeoniflorin induced autophagy activation involving mTOR/P70S6K/S6 signaling and promoted c-Met autophagic degradation, a process dependent on K63-linked c-Met polyubiquitination. Finally, paeoniflorin suppressed mesenchymal makers (snail, vimentin, N-cadherin) and inhibited angiogenesis via the identical mechanism in an orthotopic xenograft mouse model. The in vitro and in vivo experiments showed that paeoniflorin treatment inhibited EMT, angiogenesis and activated autophagy. What's more, for the first time, we identified c-Met may be a potential target of paeoniflorin and demonstrated paeoniflorin downregulated c-Met via K63-linked c-Met polyubiquitination-dependent autophagic degradation. Collectively, these findings indicated that paeoniflorin inhibits EMT and angiogenesis via K63-linked c-Met polyubiquitination-dependent autophagic degradation in human glioblastoma.

Keywords: EMT; angiogenesis; autophagy; c-Met; glioblastoma; paeoniflorin; polyubiquitination.


Conflict of interest statement

The authors declare that the research was conducted in the absence of any commercial or financial relationships that could be construed as a potential conflict of interest.

Figures

Figure 1
Figure 1
The effects of paeoniflorin on c-Met in the glioblastoma cell lines U87 and U251. (A) The cells were incubated with the indicated concentrations (0,10,20 μM) of paeoniflorin for 24 hours, and western blotting was performed to analyze the protein expression levels of c-Met and the downstream signaling molecules. (B) The effect of paeoniflorin on HGF-induced p-c-Met activity in U87 and U251 cells. U87 and U251 cells were treated with or without 20 μM paeoniflorin for 24 hours and then incubated with or without 20 nM HGF for 30 minutes. The cells were collected, and western blotting was performed to analyze p-c-Met protein expression levels. All tests were performed in triplicate and the data are presented as the mean ± standard error.
Figure 2
Figure 2
c-Met overexpression reduced the effects of paeoniflorin on cell proliferation, migration and invasion and EMT. (A) U87 cells and U251 cells transfected with c-Met or vector plasmids for 12 hours were harvested, and 4×10³ cells were seeded in a 96-well plate and then incubated with 10 μM paeoniflorin or PBS for 24 hours. CCK-8 assay was used to detect cell proliferation. (B) U87 cells and U251 cells transfected with c-Met or vector plasmids for 12 hours were harvested, and 1×10⁵ cells were seeded in 6-well plates and then incubated with 10 μM paeoniflorin or PBS for 24 hours. Wound-healing assay was performed to detect U87 and U251 cell migration. (C) U87 cells and U251 cells transfected with c-Met or vector plasmids for 12 hours were harvested, and 2×10⁴ cells were seeded in a transwell chamber. Transwell assay was performed to evaluate U87 and U251 cell invasion ability. (D) U87 and U251 cells were incubated with the indicated concentration of paeoniflorin for 24 hours. Western blotting was performed to examine protein expression. (E) U87 and U251 cells were transfected with c-Met or vector plasmids for 12 hours then treated with 20 μM paeoniflorin for 24 hours. Western blotting was performed to examine protein expression. Control: transfected with vector; paeoniflorin: transfected with vector+20 μM paeoniflorin; ex-c-Met: transfected with c-Met; ex-c-Met+paeoniflorin: transfected with c-Met+20 μM paeoniflorin. *P<0.05 vs control. #P<0.05, compared with either paeoniflorin treatment or c-Met transfection alone.
Figure 3
Figure 3
The effect of paeoniflorin on angiogenesis and c-Met overexpression reduced the effects of paeoniflorin on angiogenesis in HUVECs. HUVECs were treated with the indicated concentration of paeoniflorin, and then (A) CCK-8 assay was performed to detect cell proliferation. (B, C) Wound-healing and transwell assays were performed to detect cell migration and invasion ability, respectively. (D) Tube formation assay was performed to evaluate angiogenic ability. (E) CAM assay was used to examine the effect of paeoniflorin on angiogenesis. CAMs were treated with 0 or 20 μM paeoniflorin, after which the numbers of micro vessels were counted. (F) The effect of paeoniflorin on HGF-induced p-c-Met activity in HUVECs. HUVECs were treated with or without 20 μM paeoniflorin for 24 hours and then incubated with or without 20 nM HGF for 30 minutes. The cells were collected, and western blotting was performed to analyze p-c-Met protein expression. (G) HUVECs transfected with c-Met or vector plasmids for 12 hours were harvested, and 4×10³ cells were seeded in a 96-well plate and then incubated with 20 mM paeoniflorin or PBS for 24 hours. CCK-8 assay was used to detect cell proliferation (H) HUVECs transfected with c-Met or vector plasmids for 12 hours were harvested, and 1×10⁵ cells were seeded in a 6-well plate and then incubated with 20 mM paeoniflorin or PBS for 24 hours. Wound-healing assay was performed to detect cell migration ability.) (I) HUVECs transfected with c-Met or vector plasmids for 12 hours were harvested, and 2×10⁴ cells were seeded in a transwell chamber. Transwell assay was then performed to evaluate cell invasion ability. (J) HUVECs transfected with c-Met or vector plasmids for 12 hours were harvested, and 1×10⁴ cells were seeded in 24-well plates. Tube formation assay was then performed to evaluate angiogenic ability. (K) HUVECs were transfected with c-Met or vector plasmids for 12 hours and then treated with 20 mM paeoniflorin for 24 hours. Western blotting was performed to examine c-Met and VEGF protein expression. Control: transfected with vector; paeoniflorin: transfected with vector+20 mM paeoniflorin; ex-c-Met: transfected with c-Met; ex-c-Met+paeoniflorin: transfected with c-Met+20 mM paeoniflorin. *P<0.05 vs control. #P<0.05, compared with either paeoniflorin treatment or c-Met transfection alone.
Figure 4
Figure 4
Paeoniflorin induced autophagy in glioblastoma cells and HUVECs. (A) U87 and U251 cells and HUVECs transfected with LC3-GFP plasmids for 24 hours were treated with the indicated concentration of paeoniflorin for 12 hours and then imaged, and the numbers of punctate in each cell were counted. Bars, 7.5 μm. (B) U87, U251 cells and HUVECs were treated with the indicated concentration of paeoniflorin for 12 hours, and then the cells were harvested before being analyzed by electron microscopy. The number of autophagosomes was counted. Bars, 1 μm. (C) U87, U251 cells and HUVECs were treated with the indicated concentration of paeoniflorin for 24 hours, and then p-mTOR, p-P70S6K, p-S6 and LC3 and P62 protein expression was determined by western blotting. All tests were performed in triplicate, and the data are presented as the mean ± standard error. *P<0.05, compared with control (0 µM).
Figure 5
Figure 5
Paeoniflorin promoted K63-linked c-Met polyubiquitination-dependent autophagic degradation in glioblastoma cells and HUVECs. (A) c-Met mRNA expression was detected by qRT-PCR in cells treated with different concentrations of paeoniflorin and was normalized to GAPDH expression. Expression was expressed as a fold change relative to 0 μM paeoniflorin-treated U87, U251 cells and HUVECs. (B) U87, U251 cells and HUVECs were incubated with 5 mM 3-MA, 20 μM CQ or 5 μM MG132 for 6 hours before being treated with 20 μM paeoniflorin or PBS for 18 hours. c-Met protein expression was estimated by western blotting. (C) U87, U251 cells and HUVECs were treated with 50 nM or 100 nM rapamycin for 24 hours. c-Met and LC3 protein expression was assessed by western blotting. (D) Time course of c-Met degradation. Top panel, CHX (100 μg/mL) was added to U87, U251 cells and HUVECs treated with or without 20 μM paeoniflorin for 24 hours, after which western blot analysis was performed. Bottom panel, quantified c-Met band intensities, which are representative of three separate analyses by ImageJ (National Institute of Mental Health, Bethesda, MD, USA). The relative intensities of each band from the cell samples were quantified by densitometry as a function of time, with the dotted line (—) indicating the half-life (T½) of c-Met protein in U87 and U251 cells and HUVECs. U87 cells and HUVECs were treated with paeoniflorin (10 μM in U87 cells and 20 μM in HUVECs) for 24 hours. The lysates were subjected to immunoprecipitation, which was performed with antibodies against c-Met, and immunoblot analysis, which was performed with antibodies against (E) ubiquitin (P4D1) that recognized monoubiquitin and polyubiquitin and (F) antibodies against FK1 that recognized polyubiquitin and p62. U87 cells transfected (G) with HA–Ub (WT), HA-UbK48, HA-UbK63 or HA-UbKO or (H) with HA–Ub (WT), HA-UbK63R for 12 hours followed by incubating with 20 μM paeoniflorin for 24 hours. The lysates were subjected to immunoprecipitation with antibodies against c-Met and immunoblot analysis.
Figure 6
Figure 6
Effects of paeoniflorin on the orthotopic xenograft mouse model. U87-luciferace cells (1×10⁶) were intracranially injected into the mid-right striatum of 6-week-old female BALB/c nude mice. Ten days post-injection, tumor formation was detected by bioluminescence imaging, and the mice were separated into the following two groups: a group comprising mice that were intraperitoneally injected with PPS (control) and a group comprising mice that were intraperitoneally injected with paeoniflorin (400 mg/kg/day). Tumor sizes were measured once every 7 days. Bioluminescence imaging was used to measure tumor volumes. (A) A representative tumor volume in each group is shown at each time point (B) Tumor volumes were examined at each time point in each group. (C) The survival rate of each group. (D) Body weight changes in each group. At the end of the experiment or after the mice had died, the brains were excised (E) and were stained for c-Met (Bar, 20 μm) and (F) VWF (Bar, 50 μm). The images were analyzed by Image-Pro-Plus. At the end of the experiment or after the mice had died, the tumor tissues were excised, and the protein lysates (G) were used to estimate c-Met, VEGF and EMT markers expression; (H) mTOR/P70S6K/s6 signaling pathway expression; and autophagy-related protein (p62 and LC3) expression by western blotting. (I) The lysates were immunoprecipitated with anti-c-Met antibody and immunoblotted with antibodies against c-Met and p62. Normal mice were treated PBS or paeoniflorin (400/kg/day) (for each group n=5) for 30 days (J) and the body weights were recorded (K) after 30 days, the kidney and liver tissues were obtained and HE-stained (Bar, 500 μm). *P<0.05, compared with control.

Similar articles

Cited by

References

    1. Omuro A, DeAngelis LM. Glioblastoma and Other Malignant Gliomas: A Clinical Review. JAMA (2013) 310(17):1842–50. doi: 10.1001/jama.2013.280319 - DOI - PubMed
    1. Khan MK, Hunter GK, Vogelbaum M, Suh JH, Chao ST. Evidence-Based Adjuvant Therapy for Gliomas: Current Concepts and Newer Developments. Indian J Cancer (2009) 46(2):96–107. - PubMed
    1. Preusser M, de Ribaupierre S, Wöhrer A, Erridge SC, Hegi M, Weller M, et al. . Current Concepts and Management of Glioblastoma. Ann Neurol (2011) 70(1):9–21. doi: 10.1002/ana.22425 - DOI - PubMed
    1. De Craene B, Berx G. Regulatory Networks Defining EMT During Cancer Initiation and Progression. Nat Rev Cancer (2013) 13(2):97–110. doi: 10.1038/nrc3447 - DOI - PubMed
    1. Tsai JH, Yang J. Epithelial-Mesenchymal Plasticity in Carcinoma Metastasis. Genes Dev (2013) 27(20):2192–206. doi: 10.1101/gad.225334.113 - DOI - PMC - PubMed