

Effect of Pyroptosis-Related Genes on the Prognosis of Breast Cancer
- PMID: 35957895
- PMCID: PMC9357945
- DOI: 10.3389/fonc.2022.948169
Effect of Pyroptosis-Related Genes on the Prognosis of Breast Cancer
Abstract
Backgrounds: Pyroptosis, a newly pattern of specific programmed cell death, has been reported to participate in several cancers. However, the value of pyroptosis in breast cancer (BRCA) is still not clear.
Methods: Herein, we analyzed the data of BRCA from both The Cancer Genome Atlas (TCGA) and GSEA MSigDB database. Based on the obtained pyroptosis-related genes (PRGs), we searched the interactions by STRING. After that, we performed clustering analysis by ConsensusClusterPlus. The PRGs with significant prognostic value were then screened through univariate cox regression and further evaluate by constructing a risk model by least absolute shrinkage and selection operator (LASSO) Cox regression. The immune and sensitivity to drugs were also predicted by comprehensive algorithms. Finally, real-time quantitative PCR (qPCR) was performed on two of the screened signature PRGs.
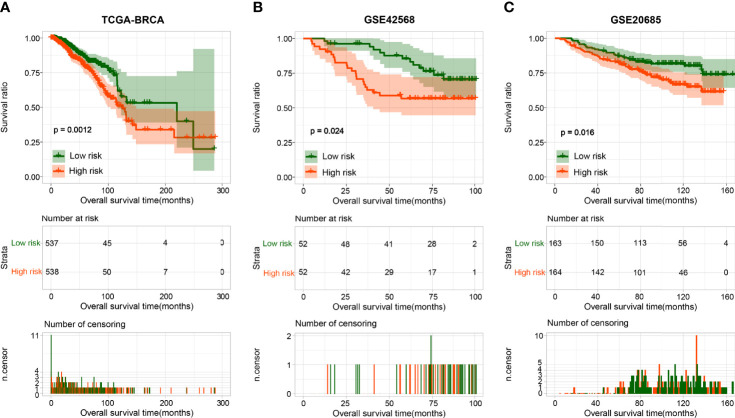
Results: A total of 49 PRGs were obtained from public database and 35 of them were significantly differentially expressed genes (DEGs). Cluster analysis was then performed to explore the relationship between DEGs with overall survival. After that, 6 optimal PRGs (GSDMC, IL-18, CHMP3, TP63, GZMB and CHMP6) were screened out to construct a prognostic signature, which divide BRCA patients into two risk groups. Risk scores were then confirmed to be independent prognostic factors in BRCA. Functional enrichment analyses showed that the signature were obviously associated with tumor-related and immune-associated pathways. 79 microenvironmental cells and 11 immune checkpoint genes were found disparate in two groups. Besides, tumor immune dysfunction and exclusion (TIDE) scores revealed that patients with higher risk scores are more sensitive to immune checkpoint blockade treatment. Patients in the low-risk group were more sensitive to Cytarabine, Docetaxel, Gefitinib, Paclitaxel, and Vinblastine. Inversely, patients in the high-risk group were more sensitive to Lapatinib. Finally, we found that, CHMP3 were down-regulated in both BRCA tissues and cell lines, while IL-18 were up-regulated.
Conclusion: PRGs play important roles in BRCA. Our study fills the gaps of 6 selected PRGs in BRCA, which were worthy for the further study as predict potential biomarkers and therapeutic targets.
Keywords: PRGs; algorithm; bioinformatic analyses; breast cancer; programmed cell death.
Copyright © 2022 Zhou, Zheng, Bai, Gao and Lin.
Conflict of interest statement
The authors declare that the research was conducted in the absence of any commercial or financial relationships that could be construed as a potential conflict of interest.
Figures


Similar articles
-
Pyroptosis-Related Gene Signature Predicts Prognosis and Indicates Immune Microenvironment Infiltration in Glioma.Front Cell Dev Biol. 2022 Apr 25;10:862493. doi: 10.3389/fcell.2022.862493. eCollection 2022. Front Cell Dev Biol. 2022. PMID: 35547808 Free PMC article.
-
Identification of a pyroptosis-related prognostic signature in breast cancer.BMC Cancer. 2022 Apr 20;22(1):429. doi: 10.1186/s12885-022-09526-z. BMC Cancer. 2022. PMID: 35443644 Free PMC article.
-
A Pyroptosis-Related Gene Signature Predicts Prognosis and Immune Microenvironment for Breast Cancer Based on Computational Biology Techniques.Front Genet. 2022 Apr 7;13:801056. doi: 10.3389/fgene.2022.801056. eCollection 2022. Front Genet. 2022. PMID: 35464869 Free PMC article.
-
A pyroptosis-related gene signature predicting survival and tumor immune microenvironment in breast cancer and validation.BMC Cancer. 2022 Sep 22;22(1):1005. doi: 10.1186/s12885-022-09856-y. BMC Cancer. 2022. PMID: 36138348 Free PMC article.
-
A novel pyroptosis related genes signature for predicting prognosis and estimating tumor immune microenvironment in lung adenocarcinoma.Transl Cancer Res. 2022 Aug;11(8):2647-2659. doi: 10.21037/tcr-22-327. Transl Cancer Res. 2022. PMID: 36093538 Free PMC article.
Cited by
-
CHMP3 promotes the progression of hepatocellular carcinoma by inhibiting caspase‑1‑dependent pyroptosis.Int J Oncol. 2024 Jan;64(1):8. doi: 10.3892/ijo.2023.5596. Epub 2023 Dec 1. Int J Oncol. 2024. PMID: 38038147 Free PMC article.
-
ELK4 targets CHMP6 to inhibit ferroptosis and enhance malignant properties of skin cutaneous melanoma cells.Arch Dermatol Res. 2024 Sep 21;316(9):634. doi: 10.1007/s00403-024-03367-5. Arch Dermatol Res. 2024. PMID: 39305302
-
Single-cell and bulk RNA sequencing analysis of B cell marker genes in TNBC TME landscape and immunotherapy.Front Immunol. 2023 Dec 4;14:1245514. doi: 10.3389/fimmu.2023.1245514. eCollection 2023. Front Immunol. 2023. PMID: 38111587 Free PMC article.
-
Establishing a Novel Pyroptosis-related Gene Signature and Predicting Chemical Drugs for Papillary Thyroid Cancer.Curr Pharm Biotechnol. 2025;26(8):1232-1244. doi: 10.2174/0113892010325685241029113633. Curr Pharm Biotechnol. 2025. PMID: 39492777
-
Integration of transcriptomics and machine learning for insights into breast cancer: exploring lipid metabolism and immune interactions.Front Immunol. 2024 Oct 25;15:1470167. doi: 10.3389/fimmu.2024.1470167. eCollection 2024. Front Immunol. 2024. PMID: 39524444 Free PMC article.
References
-
- Friedlander AM: Macrophages are Sensitive to Anthrax Lethal Toxin Through an Acid-Dependent Process. J Biol Chem (1986) 261(16):7123–6. - PubMed
LinkOut - more resources
Full Text Sources
Miscellaneous