

Validation and analysis of expression, prognosis and immune infiltration of WNT gene family in non-small cell lung cancer
- PMID: 35957916
- PMCID: PMC9359207
- DOI: 10.3389/fonc.2022.911316
Validation and analysis of expression, prognosis and immune infiltration of WNT gene family in non-small cell lung cancer
Abstract
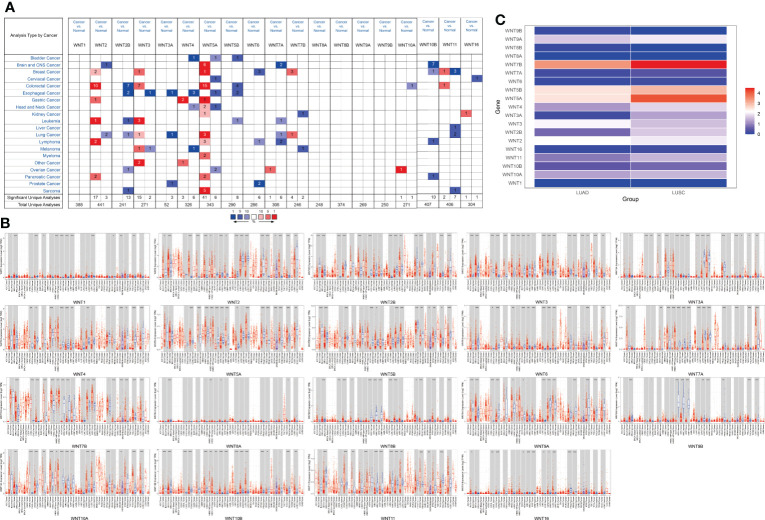
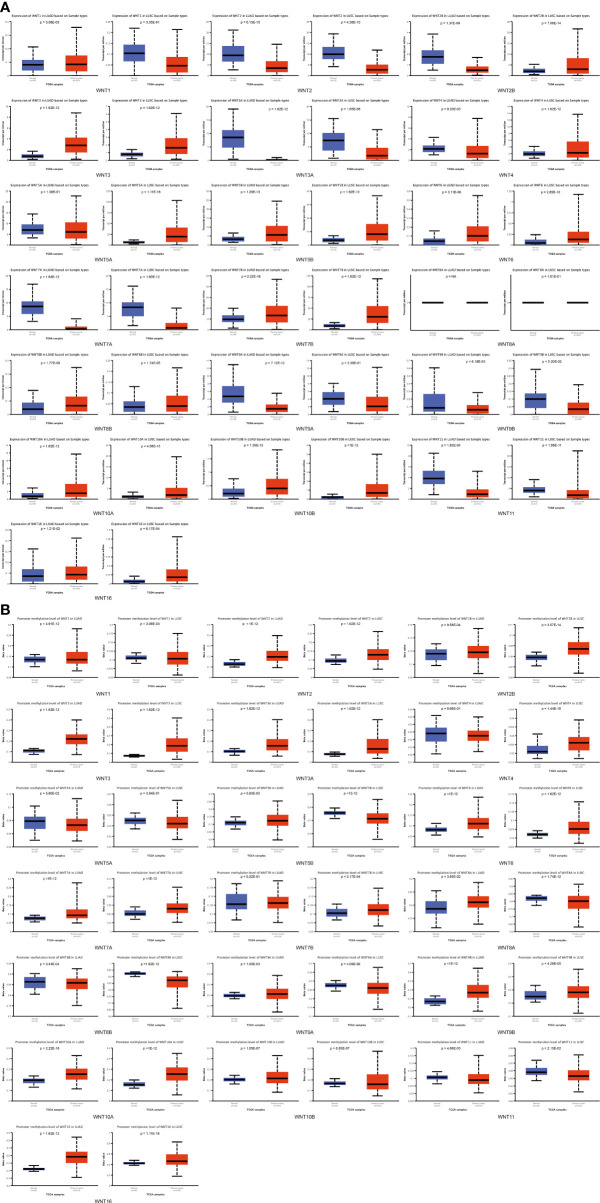
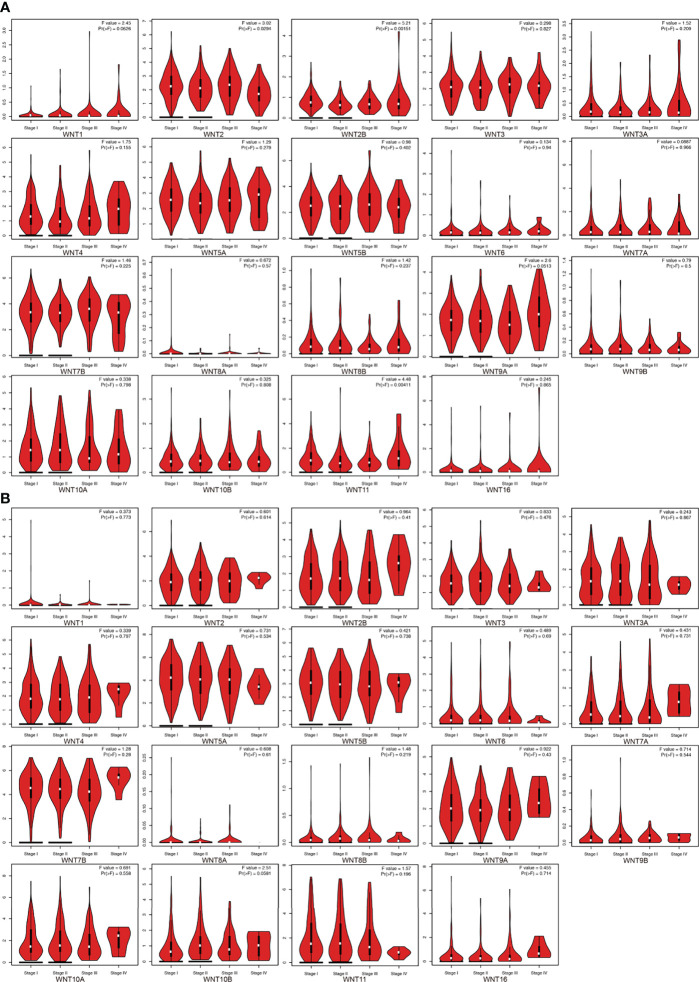
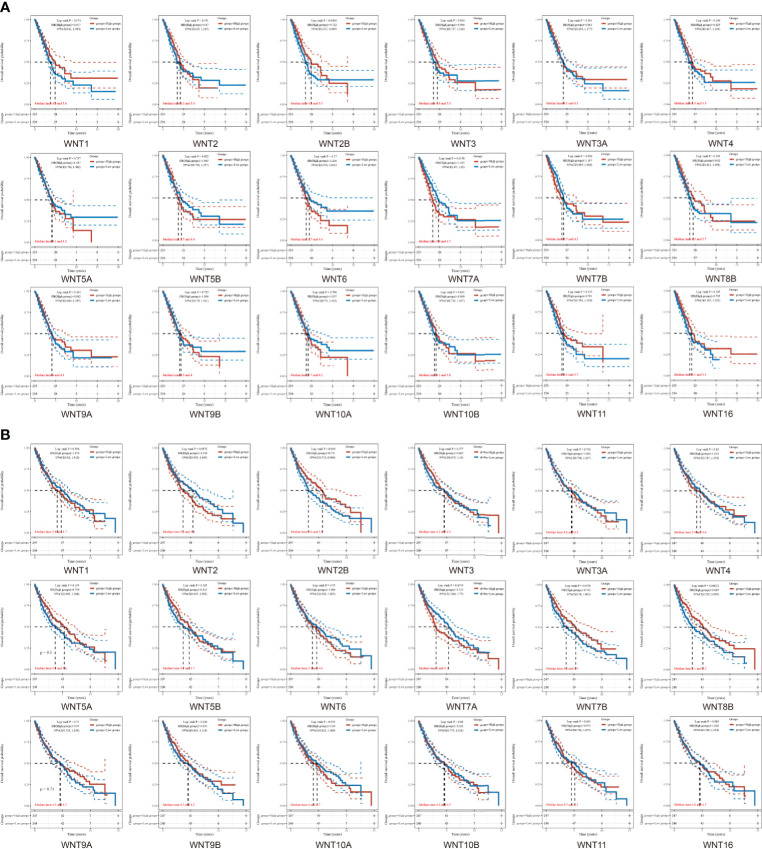
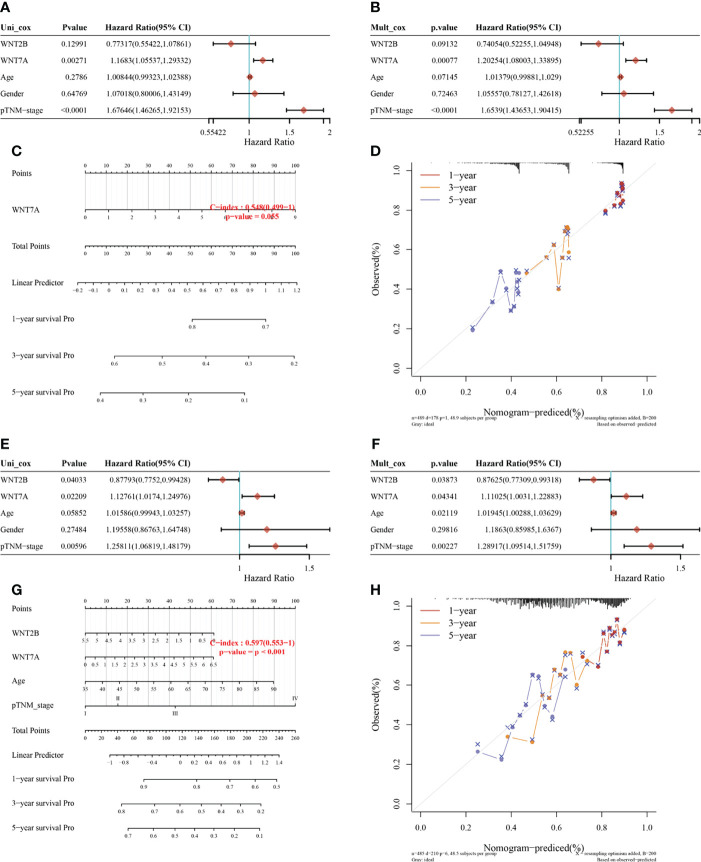
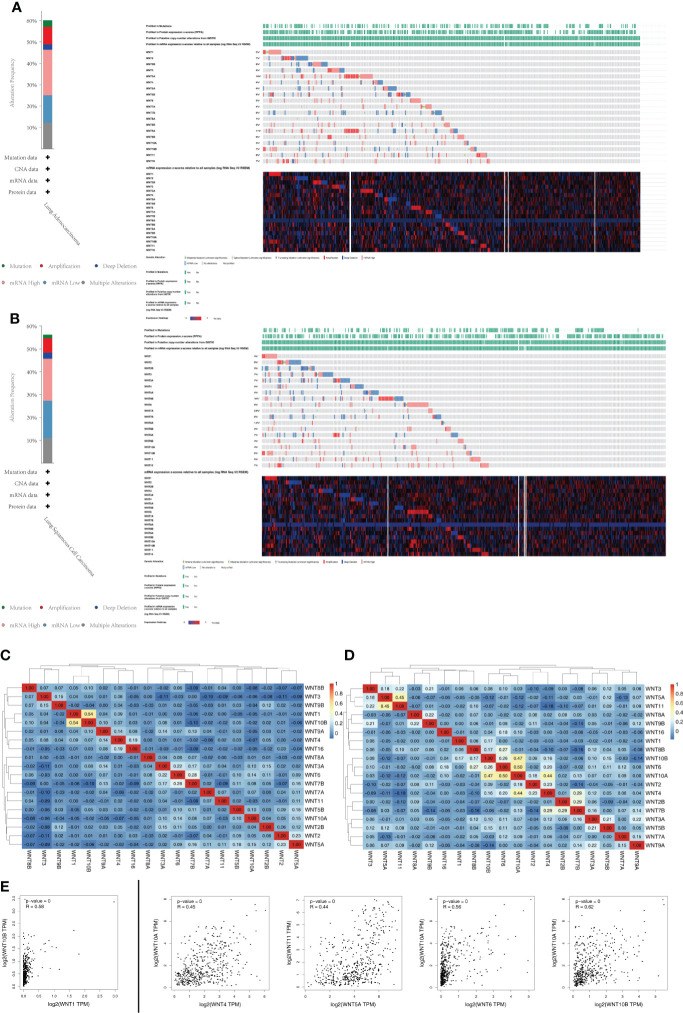
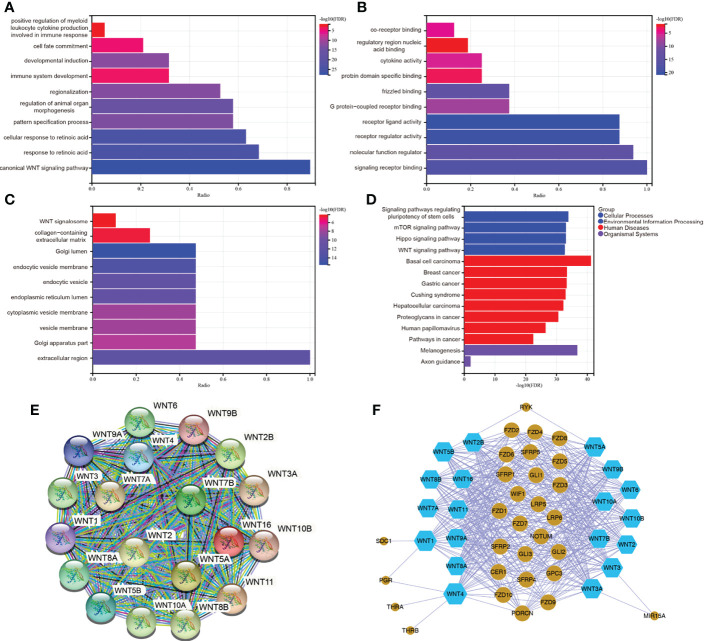
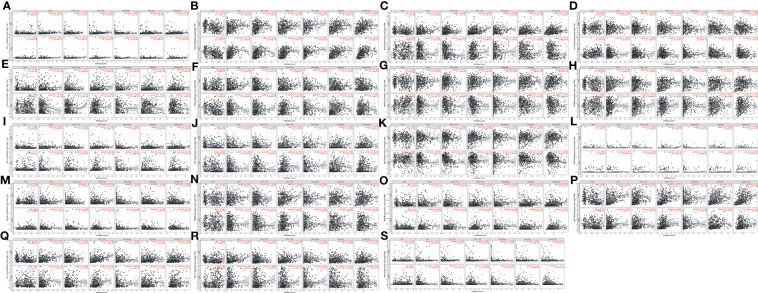
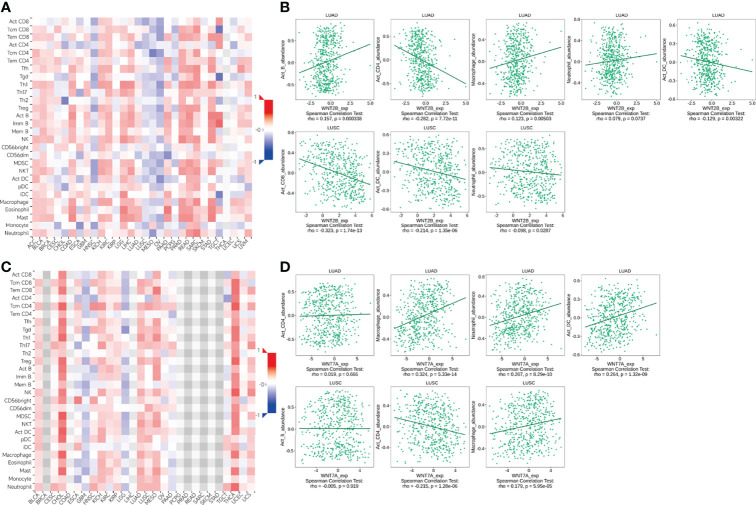
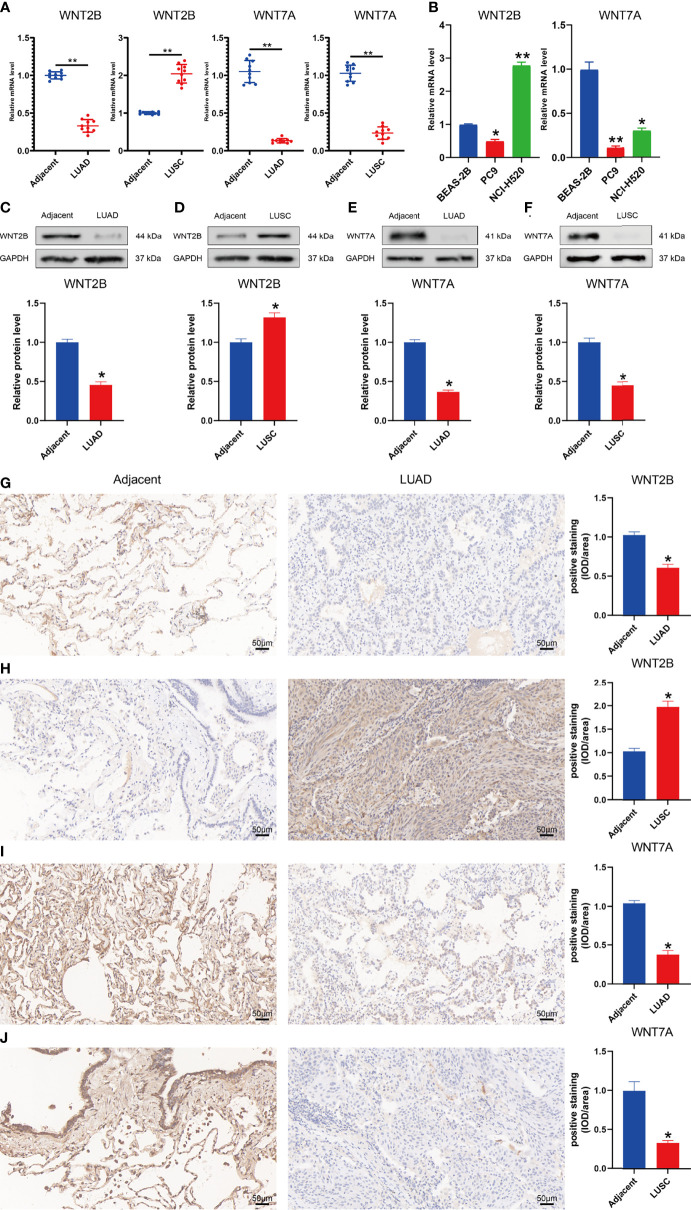
Early diagnosis and prognosis prediction of non-small cell lung cancer (NSCLC) have been challenging. Signaling cascades involving the Wingless-type (WNT) gene family play important biological roles and show prognostic value in various cancers, including NSCLC. On this basis, this study aimed to investigate the significance of WNTs in the prognosis and tumor immunity in NSCLC by comprehensive analysis. Expression and methylation levels of WNTs were obtained from the ONCOMINE, TIMER, and UALCAN. The dataset obtained from The Cancer Genome Atlas (TCGA) was utilized for prognostic analysis. cBioPortal was used to perform genetic alterations and correlation analysis of WNTs. R software was employed for functional enrichment and pathway analysis, partial statistics, and graph drawing. TRRUST was used to find key transcription factors. GEPIA was utilized for the analysis of expression, pathological staging, etc. Correlative analysis of immune infiltrates from TIMER. TISIDB was used for further immune infiltration validation analysis. Compared with that of normal tissues, WNT2/2B/3A/4/7A/9A/9B/11 expressions decreased, while WNT3/5B/6/7B/8B/10A/10B/16 expressions increased in lung adenocarcinoma (LUAD); WNT2/3A/7A/11 expressions were lessened, while WNT2B/3/5A/5B/6/7B/10A/10B/16 expressions were enhanced in squamous cell lung cancer (LUSC). Survival analysis revealed that highly expressed WNT2B and lowly expressed WNT7A predicted better prognostic outcomes in LUAD and LUSC. In the study of immune infiltration levels, WNT2, WNT9B, and WNT10A were positively correlated with six immune cells in LUAD; WNT1, WNT2, and WNT9B were positively correlated with six immune cells in LUSC, while WNT7B was negatively correlated. Our study indicated that WNT2B and WNT7A might have prognostic value in LUAD, and both of them might be important prognostic factors in LUSC and correlated to immune cell infiltration in LUAD and LUSC to a certain extent. Considering the prognostic value of WNT2B and WNT7A in NSCLC, we validated their mRNA and protein expression levels in NSCLC by performing qRT-PCR, western blot, and immunohistochemical staining on NSCLC pathological tissues and cell lines. This study may provide some direction for the subsequent exploration of the prognostic value of the WNTs and their role as biomarkers in NSCLC.
Keywords: LUAD; LUSC; NSCLC; WNT gene family; immune infiltration; prognosis.
Copyright © 2022 Wang, Yang, Tang and Liu.
Conflict of interest statement
The authors declare that the research was conducted in the absence of any commercial or financial relationships that could be construed as a potential conflict of interest.
Figures
Similar articles
-
WNT ligands in non-small cell lung cancer: from pathogenesis to clinical practice.Discov Oncol. 2023 Jul 24;14(1):136. doi: 10.1007/s12672-023-00739-7. Discov Oncol. 2023. PMID: 37486552 Free PMC article. Review.
-
System analysis of FHIT in LUAD and LUSC: The expression, prognosis, gene regulation network, and regulation targets.Int J Biol Markers. 2022 Jun;37(2):158-169. doi: 10.1177/03936155221084056. Epub 2022 Mar 7. Int J Biol Markers. 2022. PMID: 35254116
-
Unveiling ficolins: diagnostic and prognostic biomarkers linked to the Tumor Microenvironment in Lung Cancer.World J Surg Oncol. 2024 Oct 10;22(1):273. doi: 10.1186/s12957-024-03558-4. World J Surg Oncol. 2024. PMID: 39390580 Free PMC article.
-
Integrative Multi-Omics Analysis of Identified NUF2 as a Candidate Oncogene Correlates With Poor Prognosis and Immune Infiltration in Non-Small Cell Lung Cancer.Front Oncol. 2021 Jun 10;11:656509. doi: 10.3389/fonc.2021.656509. eCollection 2021. Front Oncol. 2021. PMID: 34178642 Free PMC article.
-
The Effect of GLUT1 on the Survival Rate and Immune Cell Infiltration of Lung Adenocarcinoma and Squamous Cell Carcinoma: A Meta and Bioinformatics Analysis.Anticancer Agents Med Chem. 2022;22(2):223-238. doi: 10.2174/1871520621666210708115406. Anticancer Agents Med Chem. 2022. PMID: 34238200 Review.
Cited by
-
Serum and exosome WNT5A levels as biomarkers in non-small cell lung cancer.Respir Res. 2025 Apr 13;26(1):141. doi: 10.1186/s12931-025-03216-7. Respir Res. 2025. PMID: 40223089 Free PMC article.
-
SENP3 Promotes Mantle Cell Lymphoma Development through Regulating Wnt10a Expression.Curr Med Sci. 2024 Feb;44(1):134-143. doi: 10.1007/s11596-024-2829-7. Epub 2024 Jan 25. Curr Med Sci. 2024. PMID: 38273178
-
[Circ_EPHB4 regulates temozolomide sensitivity in glioma cells through the miR-424-5p/Wnt3 axis].Nan Fang Yi Ke Da Xue Xue Bao. 2025 May 20;45(5):942-953. doi: 10.12122/j.issn.1673-4254.2025.05.06. Nan Fang Yi Ke Da Xue Xue Bao. 2025. PMID: 40415425 Free PMC article. Chinese.
-
WNT ligands in non-small cell lung cancer: from pathogenesis to clinical practice.Discov Oncol. 2023 Jul 24;14(1):136. doi: 10.1007/s12672-023-00739-7. Discov Oncol. 2023. PMID: 37486552 Free PMC article. Review.
-
Overexpressed Wnt-7a acts as a potential antitumor immune modulator and predicts poor prognosis in HNSCC.Heliyon. 2025 Feb 19;11(4):e42794. doi: 10.1016/j.heliyon.2025.e42794. eCollection 2025 Feb 28. Heliyon. 2025. PMID: 40084019 Free PMC article.
References
-
- Ferlay J, Ervik M, Lam F, Colombet M, Mery L, Piñeros M, et al. . Global Cancer Observatory: Cancer Today. Lyon, France: International Agency for Research on Cancer. Available from: https://gco.iarc.fr/today.
-
- Travis WD, Brambilla E, Noguchi M, Nicholson AG, Geisinger K, Yatabe Y, et al. . Diagnosis of lung cancer in small biopsies and cytology: Implications of the 2011 international association for the study of lung Cancer/American thoracic Society/European respiratory society classification. Arch Pathol Lab Med (2013) 137(5):668–84. doi: 10.5858/arpa.2012-0263-RA - DOI - PMC - PubMed
LinkOut - more resources
Full Text Sources