

Synergistic consequences of early-life social isolation and chronic stress impact coping and neural mechanisms underlying male prairie vole susceptibility and resilience
- PMID: 35957922
- PMCID: PMC9358287
- DOI: 10.3389/fnbeh.2022.931549
Synergistic consequences of early-life social isolation and chronic stress impact coping and neural mechanisms underlying male prairie vole susceptibility and resilience
Abstract
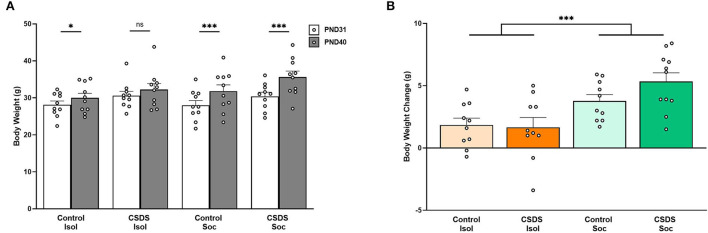
Chronic stress can be challenging, lead to maladaptive coping strategies, and cause negative mental and physical health outcomes. Early-life adversity exposes developing young to physical or psychological experiences that risks surpassing their capacity to effectively cope, thereby impacting their lifetime physical and mental wellbeing. Sensitivity to stressful events, like social isolation, has the potential to magnify stress-coping. Chronic stress through social defeat is an established paradigm that models adverse early-life experiences and can trigger enduring alterations in behavioral and neural phenotypes. To assess the degree to which stress resilience and sensitivity stemming from early-life chronic stress impact sociability, we exposed male prairie voles to chronic social defeat stress (CSDS) during adolescence. We simultaneously exposed subjects to either social isolation (CSDS+Isol) or group housing (CSDS+Soc) during this crucial time of development. On PND41, all subjects underwent a social approach test to examine the immediate impact of isolation, CSDS, or their combined effects on sociability. Unlike the CSDS+Isol group which primarily displayed social avoidance, the CSDS+Soc group was split by individuals exhibiting susceptible or resilient stress phenotypes. Notably, the Control+Soc and CSDS+Soc animals and their cage-mates significantly gained body weight between PND31 and PND40, whereas the Control+Isol and CSDS+Isol animals did not. These results suggest that the effects of early-life stress may be mitigated by having access to social support. Vasopressin, oxytocin, and opioids and their receptors (avpr1a, oxtr, oprk1, oprm1, and oprd1) are known to modulate social and stress-coping behaviors in the lateral septum (LS). Therefore, we did an mRNA expression analysis with RT-qPCR of the avpr1a, oxtr, oprk1, oprm1, and oprd1 genes to show that isolation and CSDS, or their collective influence, can potentially differentially bias sensitivity of the LS to early-life stressors. Collectively, our study supports the impact and dimensionality of early-life adversity because the type (isolation vs. CSDS), duration (acute vs. chronic), and combination (isolation + CSDS) of stressors can dynamically alter behavioral and neural outcomes.
Keywords: chronic social defeat stress (CSDS); comfort-seeking; gene concordance; lateral septum; social isolation; social support; stress resilience.
Copyright © 2022 Sailer, Patel, Park, Moon, Hanadari-Levy and Ophir.
Figures


Similar articles
-
Oxytocin treatments or activation of the paraventricular nucleus-the shell of nucleus accumbens pathway reduce adverse effects of chronic social defeat stress on emotional and social behaviors in Mandarin voles.Neuropharmacology. 2023 Jun 1;230:109482. doi: 10.1016/j.neuropharm.2023.109482. Epub 2023 Mar 7. Neuropharmacology. 2023. PMID: 36893984
-
Sex-Dependent Effects of Chronic Social Defeat on Emotional and Social Behaviors, and Parameters of Oxytocin and Vasopressin Systems in Mandarin Voles (Microtus mandarinus).Front Neurosci. 2021 May 11;15:625116. doi: 10.3389/fnins.2021.625116. eCollection 2021. Front Neurosci. 2021. PMID: 34045941 Free PMC article.
-
Characterizing the behavioral and neuroendocrine features of susceptibility and resilience to social stress.Neurobiol Stress. 2022 Feb 12;17:100437. doi: 10.1016/j.ynstr.2022.100437. eCollection 2022 Mar. Neurobiol Stress. 2022. PMID: 35242893 Free PMC article.
-
Behavioral coping with chronic defeat stress in mice: A systematic review of current protocols.Neurobiol Stress. 2024 Nov 8;33:100689. doi: 10.1016/j.ynstr.2024.100689. eCollection 2024 Nov. Neurobiol Stress. 2024. PMID: 39628708 Free PMC article. Review.
-
Demographic, Environmental, and Psychosocial Influences on Resilience Toward Chronic Stress.Cureus. 2024 Aug 27;16(8):e67897. doi: 10.7759/cureus.67897. eCollection 2024 Aug. Cureus. 2024. PMID: 39206331 Free PMC article. Review.
Cited by
-
Attachment across the lifespan: Examining the intersection of pair bonding neurobiology and healthy aging.Neurosci Biobehav Rev. 2023 Oct;153:105339. doi: 10.1016/j.neubiorev.2023.105339. Epub 2023 Aug 2. Neurosci Biobehav Rev. 2023. PMID: 37536581 Free PMC article. Review.
-
Solitude and serotonin: juvenile isolation alters the covariation between social behavior and cFos expression by serotonergic neurons.Front Neurosci. 2024 Oct 22;18:1446866. doi: 10.3389/fnins.2024.1446866. eCollection 2024. Front Neurosci. 2024. PMID: 39502712 Free PMC article.
-
Shifts in naturalistic behaviors induced by early social isolation stress are associated with adult binge-like eating in female rats.Front Behav Neurosci. 2024 Dec 12;18:1519558. doi: 10.3389/fnbeh.2024.1519558. eCollection 2024. Front Behav Neurosci. 2024. PMID: 39726771 Free PMC article.
-
Effects of short-term isolation on social behaviors in prairie voles.PLoS One. 2024 Nov 11;19(11):e0313172. doi: 10.1371/journal.pone.0313172. eCollection 2024. PLoS One. 2024. PMID: 39527561 Free PMC article.
References
-
- American Psychiatric Association . (2013). “Feeding and Eating Disorders,” in Diagnostic and Statistical Manual of Mental Disorders: DSM-5, 5th edition. (Washington, D. C.: American Psychological Association; ), 329–354.
-
- Amiri S., Haj-Mirzaian A., Rahimi-balaei M., Razmi A., Kordjazy N., Shirzadian A., et al. . (2015). Co-occurrence of anxiety and depressive-like behaviors following adolescent social isolation in male mice; possible role of nitrergic system. Physiol. Behav. 145, 38–44. 10.1016/j.physbeh.2015.03.032 - DOI - PubMed
LinkOut - more resources
Full Text Sources