

Non-Invasive Skin Imaging Assessment of Human Stress During Head-Down Bed Rest Using a Portable Handheld Two-Photon Microscope
- PMID: 35957987
- PMCID: PMC9358145
- DOI: 10.3389/fphys.2022.899830
Non-Invasive Skin Imaging Assessment of Human Stress During Head-Down Bed Rest Using a Portable Handheld Two-Photon Microscope
Abstract
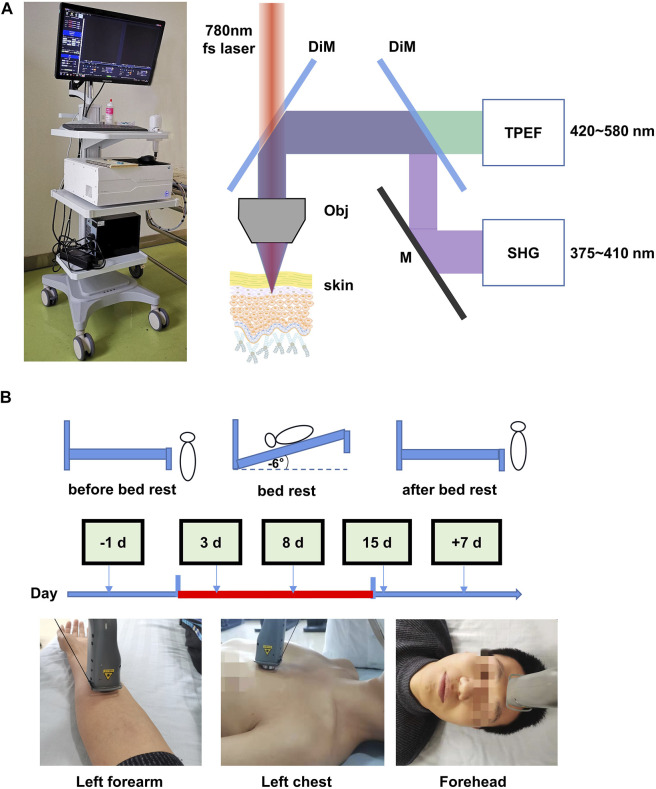
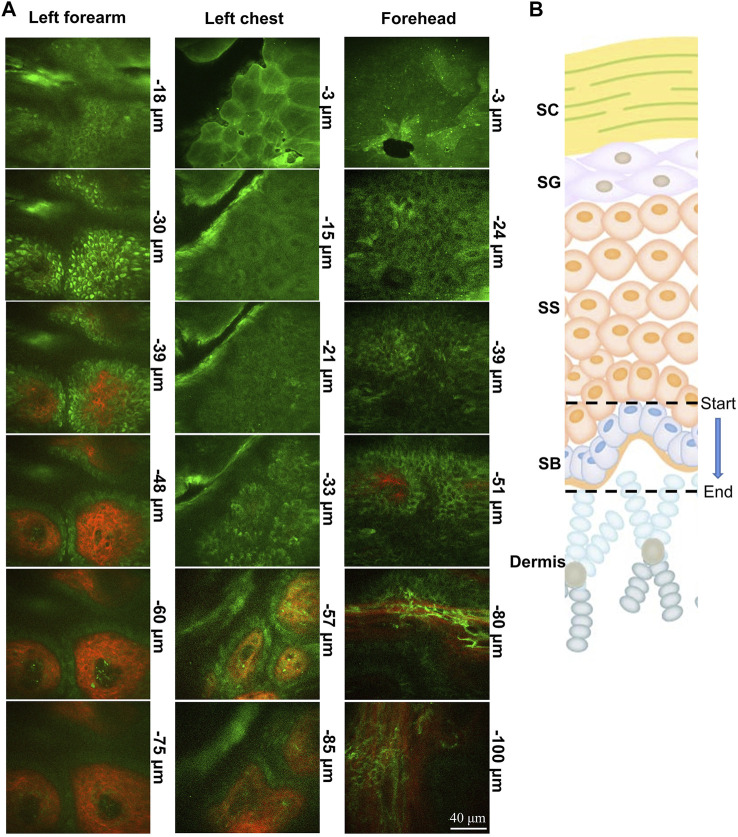
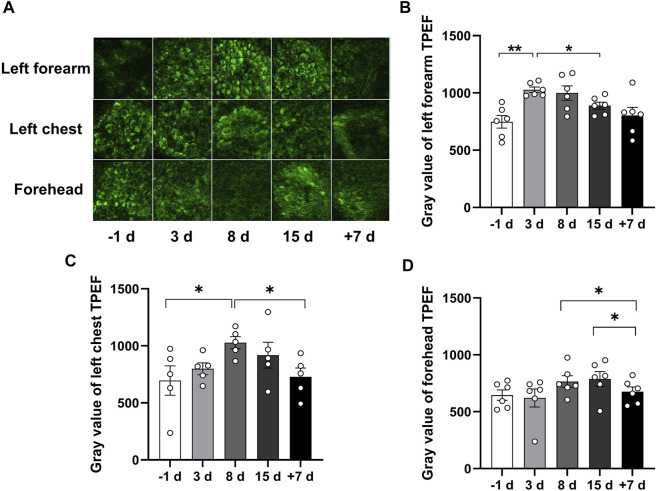
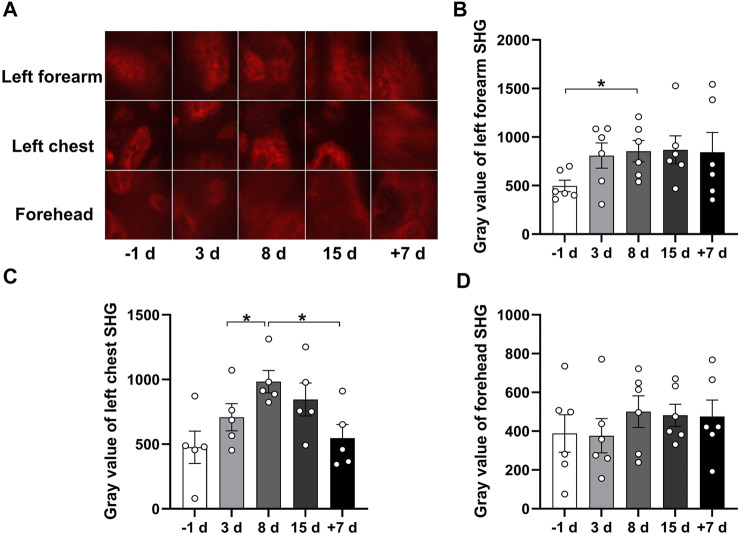
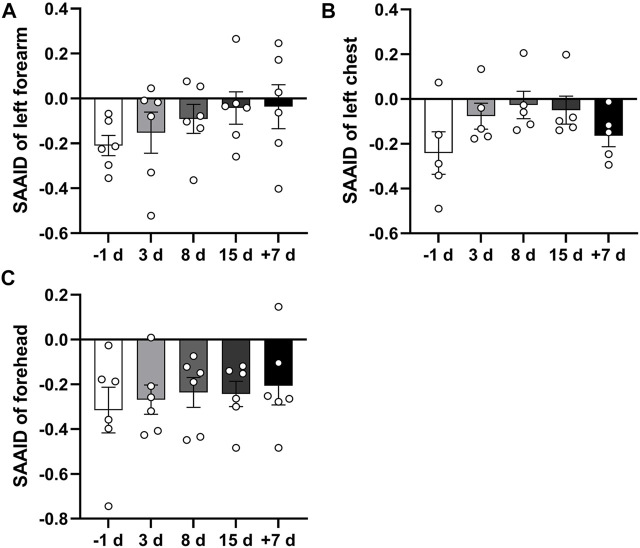
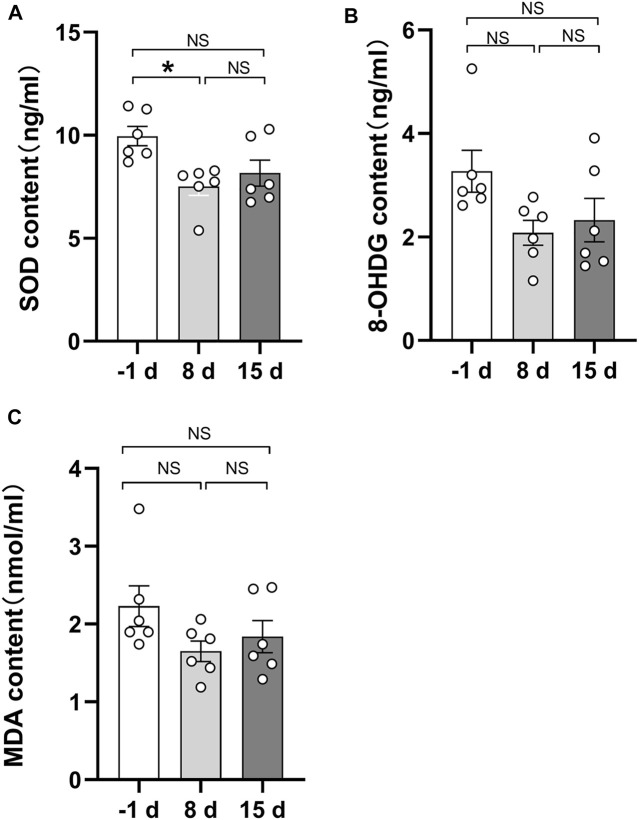
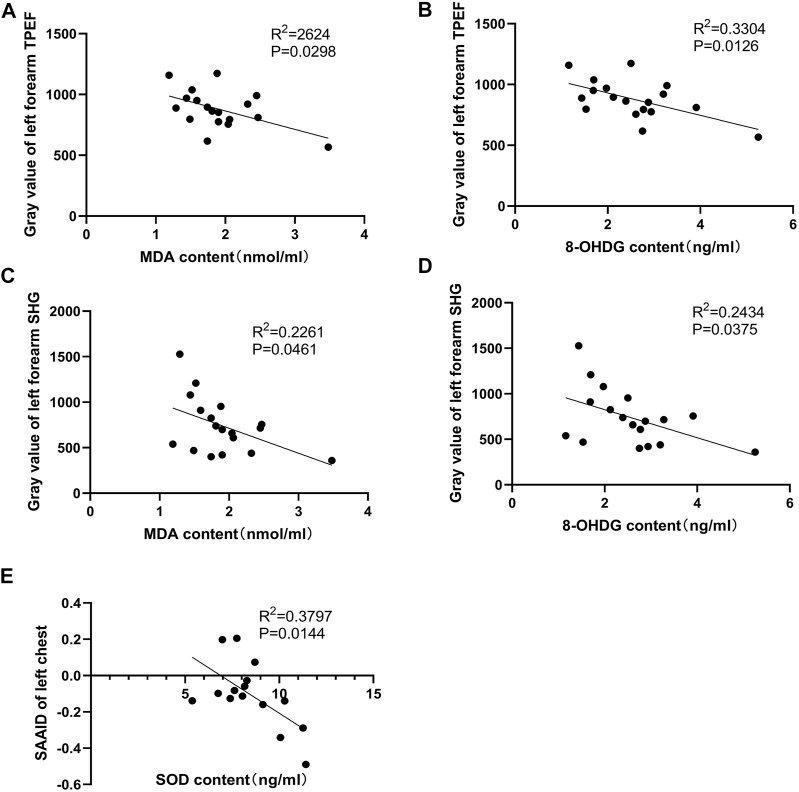
Spaceflight presents a series of physiological and pathological challenges to astronauts resulting from ionizing radiation, microgravity, isolation, and other spaceflight hazards. These risks cause a series of aging-related diseases associated with increased oxidative stress and mitochondria dysfunction. The skin contains many autofluorescent substances, such as nicotinamide adenine dinucleotide phosphate (NAD(P)H), keratin, melanin, elastin, and collagen, which reflect physiological and pathological changes in vivo. In this study, we used a portable handheld two-photon microscope to conduct high-resolution in vivo skin imaging on volunteers during 15 days of head-down bed rest. The two-photon microscope, equipped with a flexible handheld scanning head, was used to measure two-photon excited fluorescence (TPEF) and second harmonic generation (SHG) images of the left forearm, left front chest, and forehead of volunteers. Changes in TPEF, SHG, and the extended SHG-to-AF(TPEF) aging index of the dermis (SAAID) were measured. It was found that TPEF intensity increased during bed rest and was restored to normal levels after recovery. Meanwhile, SHG increased slightly during bed rest, and the skin aging index increased. Moreover, we found the skin TPEF signals of the left forearm were significantly negatively associated with the oxidative stress marker malondialdehyde (MDA) and DNA damage marker 8-hydroxy-2'-desoxyguanosine (8-OHdG) values of subjects during head-down bed rest. Meanwhile, the SHG signals were also significantly negatively correlated with MDA and 8-OHDG. A significant negative correlation between the extended SAAID of the left chest and serum antioxidant superoxide dismutase (SOD) levels was also found. These results demonstrate that skin autofluorescence signals can reflect changes in human oxidant status. This study provides evidence for in-orbit monitoring of changes in human stress using a portable handheld two-photon microscope for skin imaging.
Keywords: SHG; TPEF; head-down bed rest; portable handheld two-photon microscope; skin.
Copyright © 2022 Wang, Zhen, Wang, Wu, Hu, Fu, Li, Xin, Song, Li, Ren, Feng, Cheng, Wang, Hu, Ling and Li.
Conflict of interest statement
Authors YH and QF were employed by the company Beijing Transcend Vivoscope Bio-Technology Co. Ltd. The remaining authors declare that the research was conducted in the absence of any commercial or financial relationships that could be construed as a potential conflict of interest.
Figures
Similar articles
-
Imaging cells and extracellular matrix in vivo by using second-harmonic generation and two-photon excited fluorescence.Proc Natl Acad Sci U S A. 2002 Aug 20;99(17):11014-9. doi: 10.1073/pnas.172368799. Epub 2002 Aug 12. Proc Natl Acad Sci U S A. 2002. PMID: 12177437 Free PMC article.
-
Quantitative Analysis on Ex Vivo Nonlinear Microscopy Images of Basal Cell Carcinoma Samples in Comparison to Healthy Skin.Pathol Oncol Res. 2019 Jul;25(3):1015-1021. doi: 10.1007/s12253-018-0445-1. Epub 2018 Jul 6. Pathol Oncol Res. 2019. PMID: 29981012
-
Nonlinear spectral imaging of human hypertrophic scar based on two-photon excited fluorescence and second-harmonic generation.Br J Dermatol. 2009 Jul;161(1):48-55. doi: 10.1111/j.1365-2133.2009.09094.x. Epub 2009 Mar 20. Br J Dermatol. 2009. PMID: 19309369
-
Bed rest and accelerated aging in relation to the musculoskeletal and cardiovascular systems and frailty biomarkers: A review.Exp Gerontol. 2019 Sep;124:110643. doi: 10.1016/j.exger.2019.110643. Epub 2019 Jun 28. Exp Gerontol. 2019. PMID: 31255732 Review.
-
Optical second harmonic generation microscopy: application to the sensitive detection of cell membrane damage.Biophys Rev. 2019 Jun;11(3):399-408. doi: 10.1007/s12551-019-00546-x. Epub 2019 May 9. Biophys Rev. 2019. PMID: 31073956 Free PMC article. Review.
Cited by
-
Application of Microgravity Experiments in Plastic Surgery: A Literature Review.Plast Reconstr Surg Glob Open. 2025 May 27;13(5):e6802. doi: 10.1097/GOX.0000000000006802. eCollection 2025 May. Plast Reconstr Surg Glob Open. 2025. PMID: 40433228 Free PMC article.
References
LinkOut - more resources
Full Text Sources