. 2022 Jul 22:13:934591.
doi: 10.3389/fphys.2022.934591. eCollection 2022.

Circadian Oscillations in the Murine Preoptic Area Are Reset by Temperature, but Not Light

Affiliations

Circadian Oscillations in the Murine Preoptic Area Are Reset by Temperature, but Not Light

Nicolás M Díaz et al. Front Physiol. .

Abstract

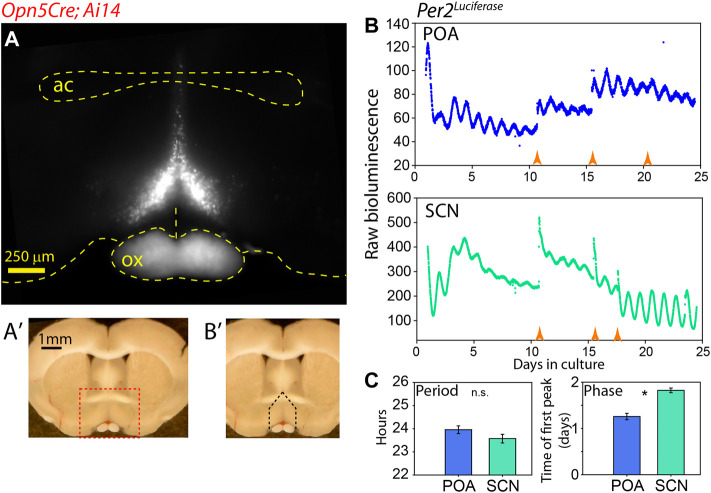
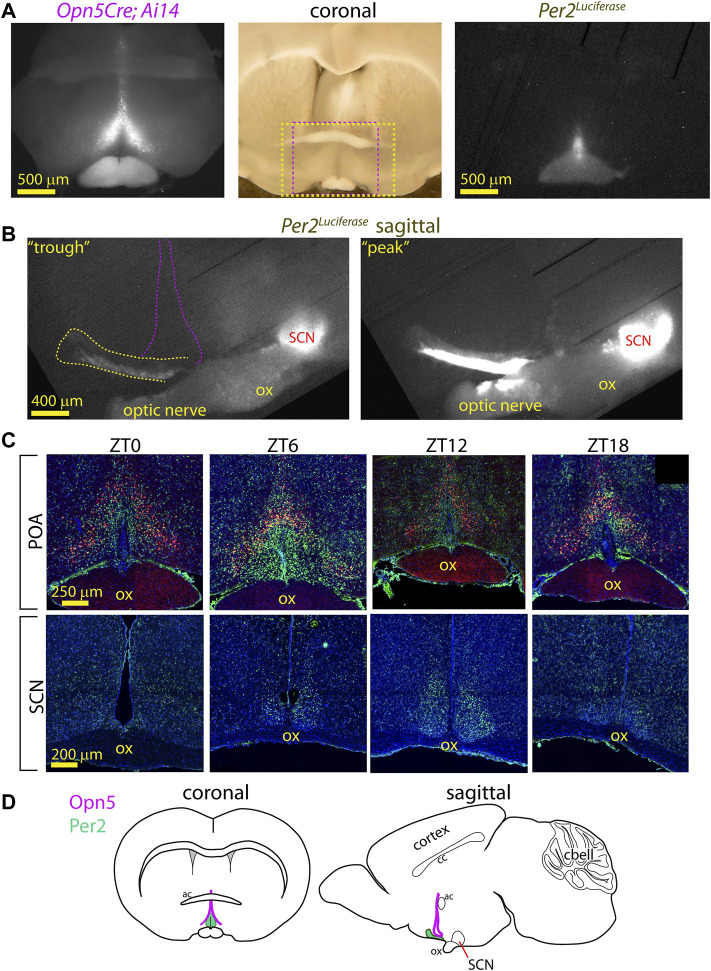
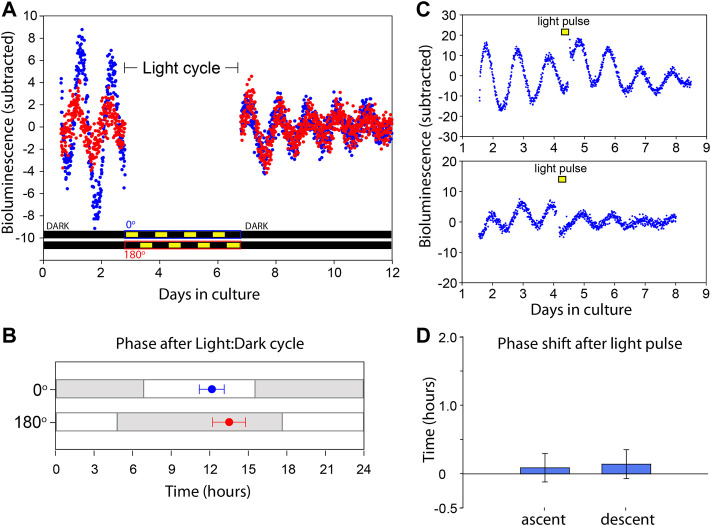
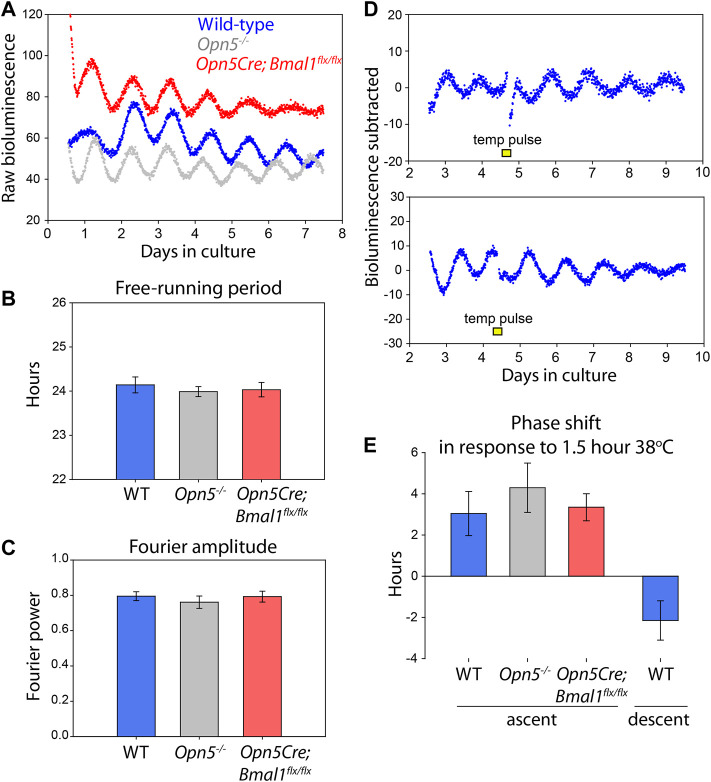
Mammals maintain their internal body temperature within a physiologically optimal range. This involves the regulation of core body temperature in response to changing environmental temperatures and a natural circadian oscillation of internal temperatures. The preoptic area (POA) of the hypothalamus coordinates body temperature by responding to both external temperature cues and internal brain temperature. Here we describe an autonomous circadian clock system in the murine ventromedial POA (VMPO) in close proximity to cells which express the atypical violet-light sensitive opsin, Opn5. We analyzed the light-sensitivity and thermal-sensitivity of the VMPO circadian clocks ex vivo. The phase of the VMPO circadian oscillations was not influenced by light. However, the VMPO clocks were reset by temperature changes within the physiological internal temperature range. This thermal-sensitivity of the VMPO circadian clock did not require functional Opn5 expression or a functional circadian clock within the Opn5-expressing cells. The presence of temperature-sensitive circadian clocks in the VMPO provides an advancement in the understanding of mechanisms involved in the dynamic regulation of core body temperature.

Keywords: Opn5; circadian rhythm; neuropsin; preoptic area; temperature.


Conflict of interest statement

The authors declare that the research was conducted in the absence of any commercial or financial relationships that could be construed as a potential conflict of interest.

Figures

FIGURE 1
FIGURE 1
Autonomous clock region near Opn5 expression in POA. (A) Fluorescence image of tdTomato expression in coronal section of Opn5 Cre/+ ; Ai14 mouse. “ac” = anterior commisure, “ox” = optic chiasm. (A) Whole brain slice showing region of detail in A as red dashed box. (B) Same image as (A) showing area of dissection for PMT measurement as black dashed lines. (B) Bioluminescence of Per2 Luciferase from a coronal POA region as highlighted in (B) (upper), and from the SCN of the same mouse (lower). Orange arrow indicate times of media change. (C) Free-running period (left) of and peak time of first full oscillation of Per2 Luciferase bioluminescence POA and SCN from the same mice. Mean ± SEM are shown for n = 8. * = p < 0.05 paired t-test.
FIGURE 2
FIGURE 2
Anatomy of PER2 region near Opn5 expression in VMPO. (A) Fluorescence image of tdTomato expression in coronal section of Opn5 Cre/+ ; Ai14 mouse (left). Long-exposure (3 h) photo of Per2 Luciferase bioluminescence from the same section (right). Center: Full light photo of coronal brain section with red dashed box indicating region of fluorescence (left) image and yellow dashed box indicating region of luciferase (right) image. (B) Bioluminescence of Per2 Luciferase from a sagittal hypothalamus showing POA region (yellow dash) in reference to the SCN and the general area of Opn5 expression (violet dashed lines). 3 h exposures from a phase roughly centered on previous CT0 (left, “trough”) or CT12 (right, “peak”). “ox” = optic chiasm. (C) Fluorescence images of tdTomato (red), PER2 (green) and nuclei (blue) in POA (upper) and SCN (lower) in coronal slices of Opn5 Cre/+ ; Ai14 mice at the indicated zeitgeber times. N = 3 at each time point. (D) Schematic diagrams of the mouse brain with regions of Opn5 and POA-PER2 expression highlighted.
FIGURE 3
FIGURE 3
VMPO circadian clock is not directly entrained by light. (A) Bioluminescence traces of Per2 Luciferase from two independent organotypic cultures (red and blue) of VMPO. The cultures are removed from PMT measurement and exposed to Light:Dark cycles from days 3 to 7. Light paradigms are indicated below for blue (0°) and red (180°) cultures. Light consisted of 415 nm, 2 × 10¹⁴ photons cm−2 s−1. (B) Phase of luminescence traces in constant darkness after exposure to oppositely phased Light:Dark cycles for 4 days. Points are average (±SEM) phases of first peak after return to PMT measurement with previous Light:Dark cycles indicated with gray and white shading. n = 8. (C) Bioluminescence traces of VMPO from Per2 Luciferase mice given 90 min light pulses where indicated with a yellow box (415 nm, 2 × 10¹⁴ photons cm−2 s−1). (D) Average phase change (comparing phase of rhythm in days 5–7 to phase in days 1–4) after a light pulse administration occurring either in the early ascending phase of the luminescence rhythm (left, and upper panel of (C) or early descending phase (right, and lower panel of (C). Shown are mean ± SEM. n = 5 each.
FIGURE 4
FIGURE 4
Opn5, and rhythms of Opn5-cells, are not necessary for VMPO rhythmicity. (A) Bioluminescence traces of Per2 Luciferase from organotypic VMPO cultures from wild-type (Per2 Luciferase , blue), Opn5 −/− ;Per2 Luciferase (gray), and Opn5-Bmal1-null (Opn5 Cre ;Bmal1 flx/flx ;Per2 Luciferase , red) mice. (B) Free-running period of 5 days of oscillations as measured by LMFit (Lumicycle Analysis). (C) Fourier power-spectrum amplitude strength between 20 and 30 h with a Blackman-Harris filter of the same VMPO rhythms as B (Lumicycle Analysis). n = 8. Shown are mean ± SEM. ANOVA, p > 0.05. (D) Bioluminescence traces of VMPO from Per2 Luciferase mice given 90 min 38°C temperature pulses (from a baseline of 36°C) where indicated with a yellow box. (E) Average phase change (comparing phase of rhythm in days 5–7 to phase in days 1–4) after a temperature pulse occurring either in the early ascending phase of the luminescence rhythm (left, three genotypes) or early descending phase (right). Shown are mean ± SEM. n = 8, 5, 6, and 5, respectively.

Similar articles

Cited by

References

    1. Abe M., Herzog E. D., Yamazaki S., Straume M., Tei H., Sakaki Y., et al. (2002). Circadian Rhythms in Isolated Brain Regions. J. Neurosci. 22 (1), 350–356. 10.1523/jneurosci.22-01-00350.2002 - DOI - PMC - PubMed
    1. Andersson B., Grant R., Larsson S. (1956). Central Control of Heat Loss Mechanisms in the Goat. Acta Physiol. Scand. 37 (2-3), 261–280. 10.1111/j.1748-1716.1956.tb01362.x - DOI - PubMed
    1. Bachtell R. K., Tsivkovskaia N. O., Ryabinin A. E. (2003). Identification of Temperature-Sensitive Neural Circuits in Mice Using C-Fos Expression Mapping. Brain Res. 960 (1-2), 157–164. 10.1016/s0006-8993(02)03807-6 - DOI - PubMed
    1. Baker F. C., Angara C., Szymusiak R., McGinty D. (2005). Persistence of Sleep-Temperature Coupling after Suprachiasmatic Nuclei Lesions in Rats. Am. J. Physiology-Regulatory, Integr. Comp. Physiology 289 (3), R827–R838. 10.1152/ajpregu.00093.2005 - DOI - PubMed
    1. Bedont J. L., LeGates T. A., Buhr E., Bathini A., Ling J. P., Bell B., et al. (2017). An LHX1-Regulated Transcriptional Network Controls Sleep/Wake Coupling and Thermal Resistance of the Central Circadian Clockworks. Curr. Biol. 27 (1), 128–136. 10.1016/j.cub.2016.11.008 - DOI - PMC - PubMed

LinkOut - more resources