

Bioinformatics analysis of lncRNAs in the occurrence and development of osteosarcoma
- PMID: 35958002
- PMCID: PMC9360822
- DOI: 10.21037/tp-22-253
Bioinformatics analysis of lncRNAs in the occurrence and development of osteosarcoma
Abstract
Background: Osteosarcoma (OS) is a disease with high mortality in children and adolescents, and metastasis is one of its important clinical features. However, the molecular mechanism of OS occurrence is not completely clear. Thus, we screened potential biomarkers of OS and analyze their prognostic value.
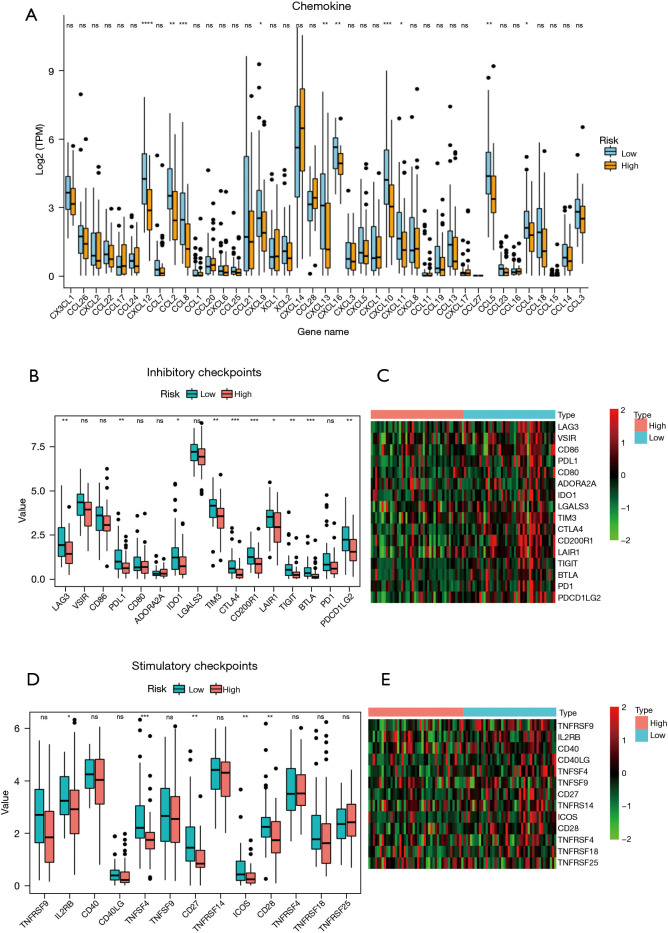
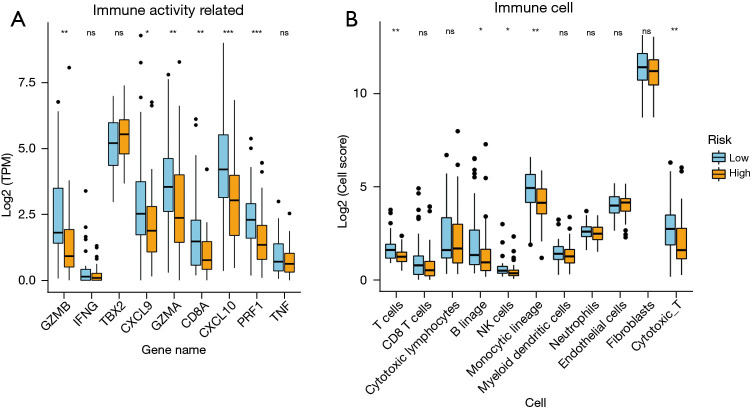
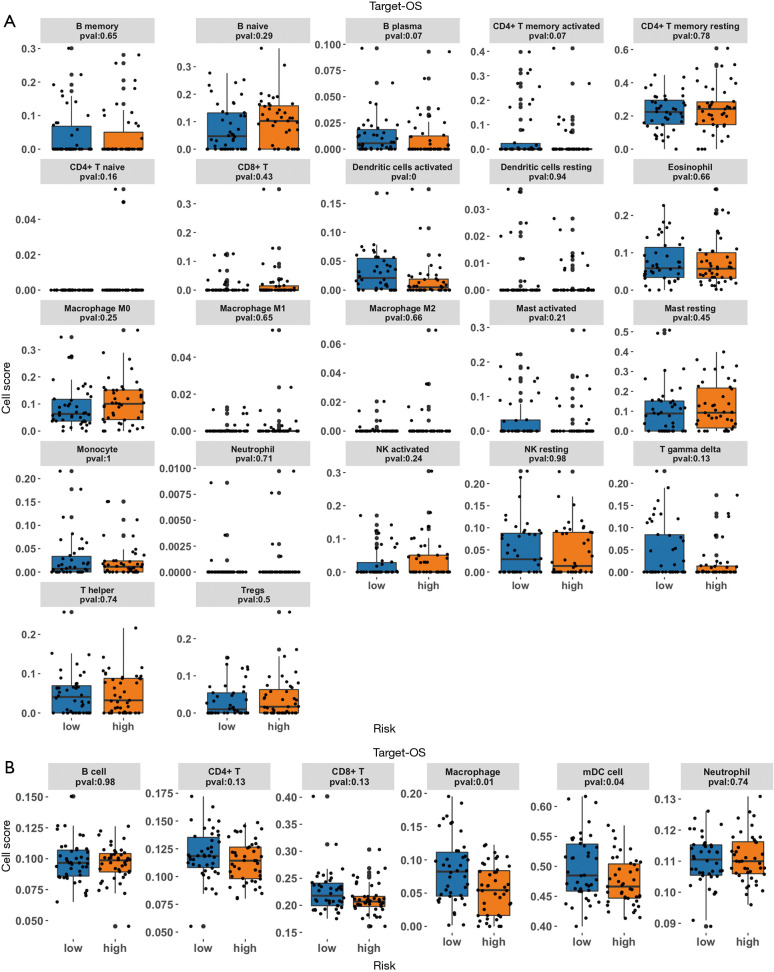
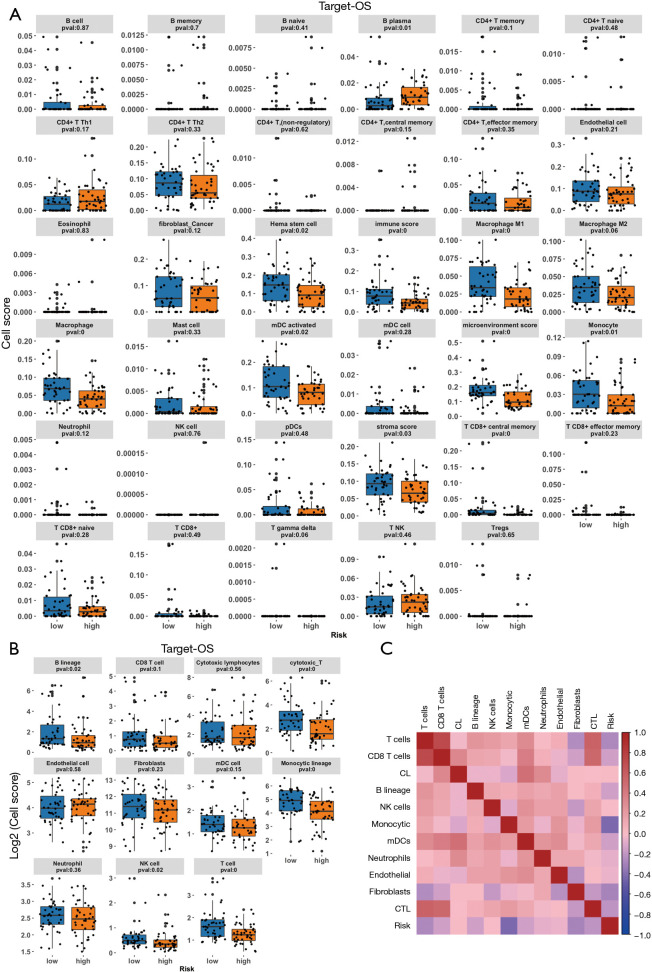
Methods: The Cancer Genome Atlas (TCGA) datasets were used to analyze the differential lncRNAs in patients with OS of different immune score and the lncRNAs expressed by immune cells. Cox regression was used to develop the prognosis prediction model and specify the prognosis outcomes. Risk-proportional regression model was constructed, and the samples were divided into high and low groups based on the risk scores for the survival analysis. The areas under the receiver operating characteristic (ROC) curve were calculated and the risk-score model was verified. Finally, using 4 gene sets (comprising chemokines, immune checkpoint blockades, immune activity-related genes, and immune cells), and 4 analysis tools (CIBERSORT, TIMER, XCELL and MCP) to evaluated tumor immune infiltration.
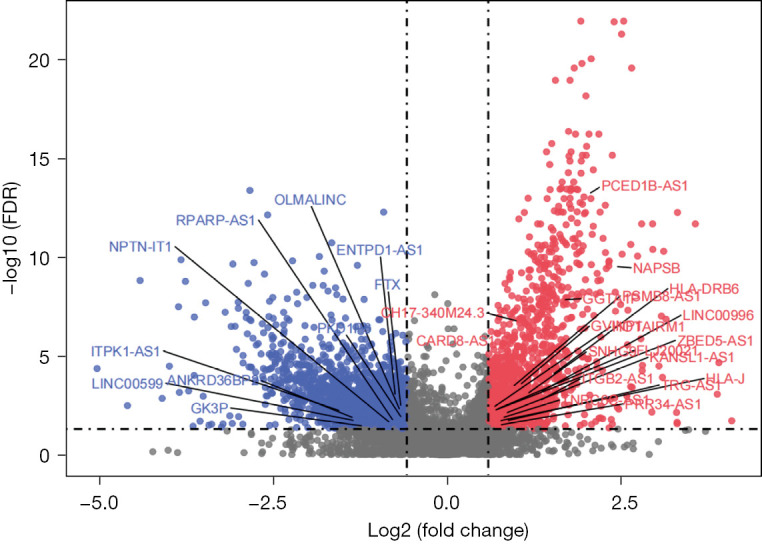
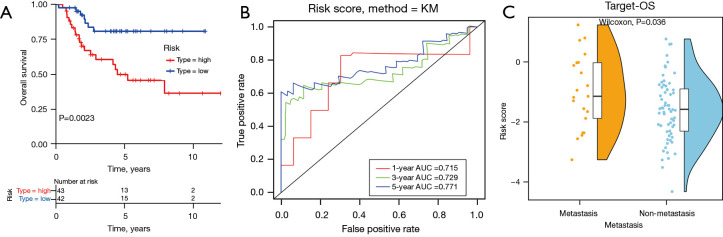
Results: Twenty-nine long non-coding ribonucleic acids (lncRNAs) were obtained from the intersection of the screened lncRNAs. Caspase recruitment domain-containing protein 8-antisense RNA 1 (CARD8-AS1), lncRNA five prime to Xist (FTX), KAT8 regulatory NSL complex unit 1-antisense RNA 1 (KANSL1-AS1), Neuroplastin Intronic Transcript 1 (NPTN-IT1), oligodendrocyte maturation-associated long intervening non-coding RNA (OLMALINC) and RPARP Antisense RNA 1 (RPARP-AS1) were found to be correlated with survival. Univariate and multivariate regression analysis showed risk score [HR (hazard ratio) 3.5, P value 0.0043; HR 3.7, P value 0.0033] and metastasis (HR 4.7, P value 6.60E-05; HR 4.8, P value 8.36E-05) were the key factors of patients with OS. The areas under curves (AUCs) of the 1-, 3-, and 5-year ROC curves of the prognostic model were 0.715, 0.729, and 0.771. The low-risk patients tended to have a high abundance of immune cells.
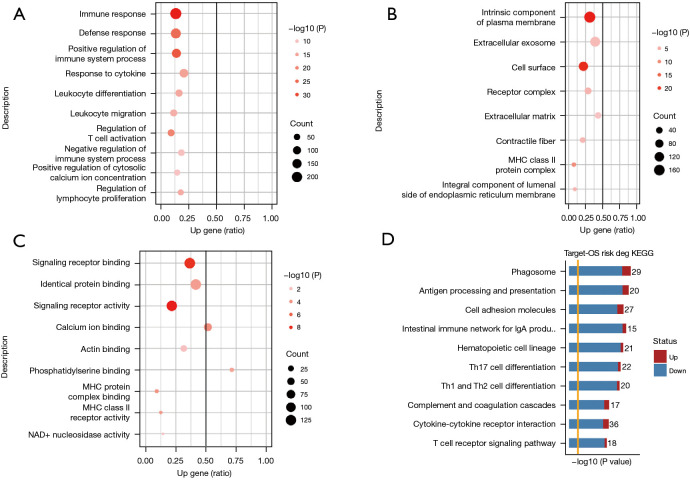
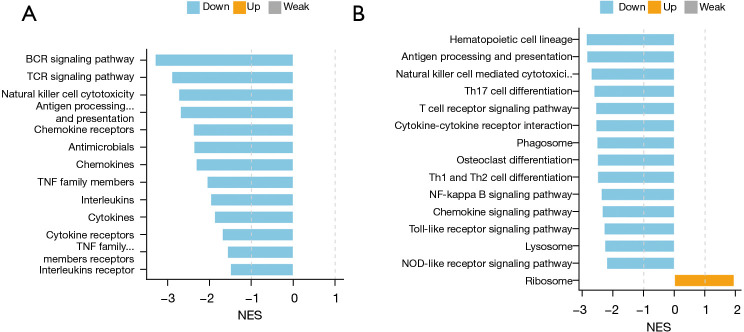
Conclusions: This study showed that a risk score based on 6 lncRNAs has potential value in the prognosis of OS, and patients with low-risk scores have high immune cell infiltration and good prognosis. This study may enrich understandings of underlying mechanisms related to the occurrence and development of OS.
Keywords: Osteosarcoma (OS); biomarker; lncRNA; prognosis.
2022 Translational Pediatrics. All rights reserved.
Conflict of interest statement
Conflicts of Interest: All authors have completed the ICMJE uniform disclosure form (available at https://tp.amegroups.com/article/view/10.21037/tp-22-253/coif). The authors have no conflicts of interest to declare.
Figures
Similar articles
-
Novel pyroptosis-related lncRNAs and ceRNAs predict osteosarcoma prognosis and indicate immune microenvironment signatures.Heliyon. 2023 Oct 31;9(11):e21503. doi: 10.1016/j.heliyon.2023.e21503. eCollection 2023 Nov. Heliyon. 2023. PMID: 38027935 Free PMC article.
-
Construction of a Necroptosis-Associated Long Non-Coding RNA Signature to Predict Prognosis and Immune Response in Hepatocellular Carcinoma.Front Mol Biosci. 2022 Jul 13;9:937979. doi: 10.3389/fmolb.2022.937979. eCollection 2022. Front Mol Biosci. 2022. PMID: 35911976 Free PMC article.
-
Autophagy-related long non-coding RNA prognostic model predicts prognosis and survival of melanoma patients.World J Clin Cases. 2022 Apr 16;10(11):3334-3351. doi: 10.12998/wjcc.v10.i11.3334. World J Clin Cases. 2022. PMID: 35611195 Free PMC article.
-
Signature constructed by glycolysis-immune-related genes can predict the prognosis of osteosarcoma patients.Invest New Drugs. 2022 Aug;40(4):818-830. doi: 10.1007/s10637-022-01228-4. Epub 2022 Apr 18. Invest New Drugs. 2022. PMID: 35435626 Review.
-
LncRNAs could play a vital role in osteosarcoma treatment: Inhibiting osteosarcoma progression and improving chemotherapy resistance.Front Genet. 2023 Jan 16;13:1022155. doi: 10.3389/fgene.2022.1022155. eCollection 2022. Front Genet. 2023. PMID: 36726721 Free PMC article. Review.
Cited by
-
Associations of placental lncRNA expression with maternal pre-pregnancy BMI and infant birthweight in two birth cohorts.J Dev Orig Health Dis. 2025 May 21;16:e20. doi: 10.1017/S204017442500011X. J Dev Orig Health Dis. 2025. PMID: 40394751
-
Deciphering the role of cuproptosis-related lncRNAs in shaping the lung cancer immune microenvironment: A comprehensive prognostic model.J Cell Mol Med. 2024 Jul;28(13):e18519. doi: 10.1111/jcmm.18519. J Cell Mol Med. 2024. PMID: 38973477 Free PMC article.
-
LncRNA RPARP-AS1 promotes the progression of osteosarcoma cells through regulating lipid metabolism.BMC Cancer. 2024 Feb 2;24(1):166. doi: 10.1186/s12885-024-11901-x. BMC Cancer. 2024. PMID: 38308235 Free PMC article.
-
Development and validation of a cuproptosis-related lncRNA model correlated to the cancer-associated fibroblasts enable the prediction prognosis of patients with osteosarcoma.J Bone Oncol. 2022 Dec 9;38:100463. doi: 10.1016/j.jbo.2022.100463. eCollection 2023 Feb. J Bone Oncol. 2022. PMID: 36569351 Free PMC article.
References
LinkOut - more resources
Full Text Sources
Miscellaneous