Review
. 2022 Jul 25:13:953300.
doi: 10.3389/fmicb.2022.953300. eCollection 2022.

Cross-kingdom co-occurrence networks in the plant microbiome: Importance and ecological interpretations

Affiliations
Review

Cross-kingdom co-occurrence networks in the plant microbiome: Importance and ecological interpretations

Kiseok Keith Lee et al. Front Microbiol. .

Abstract

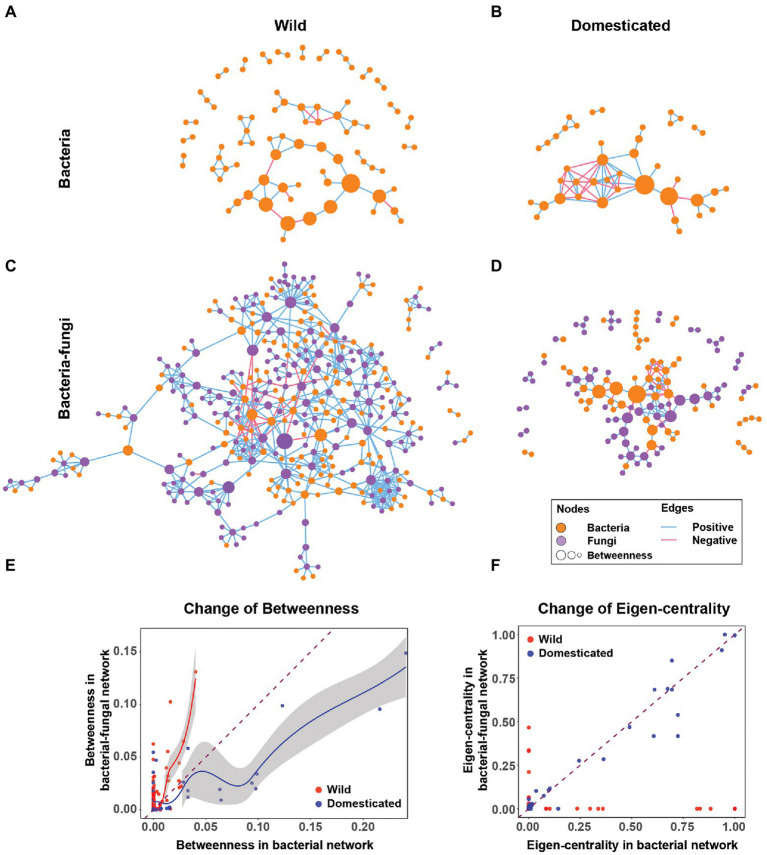
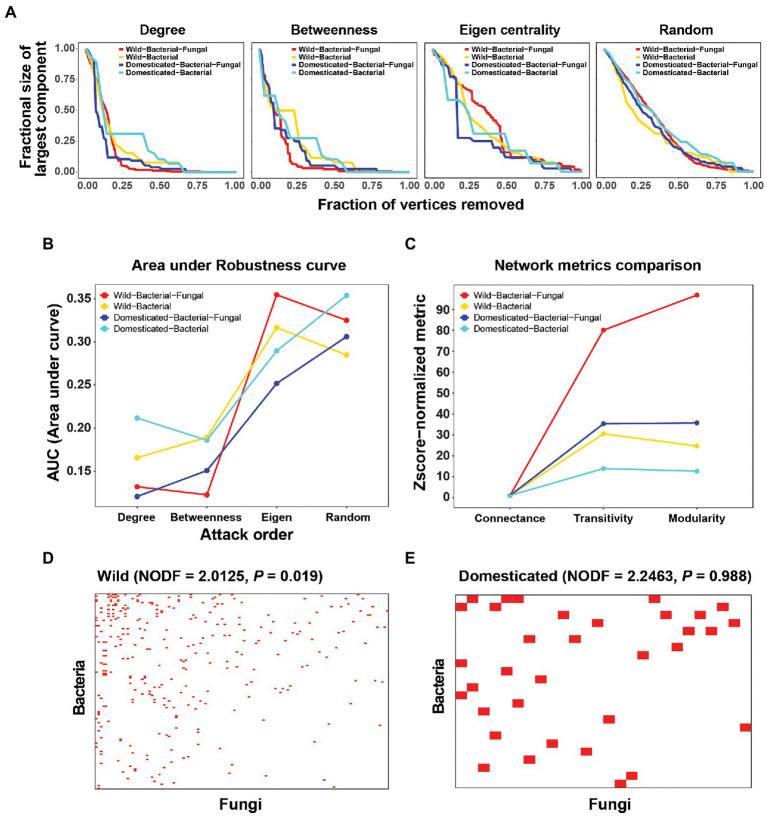
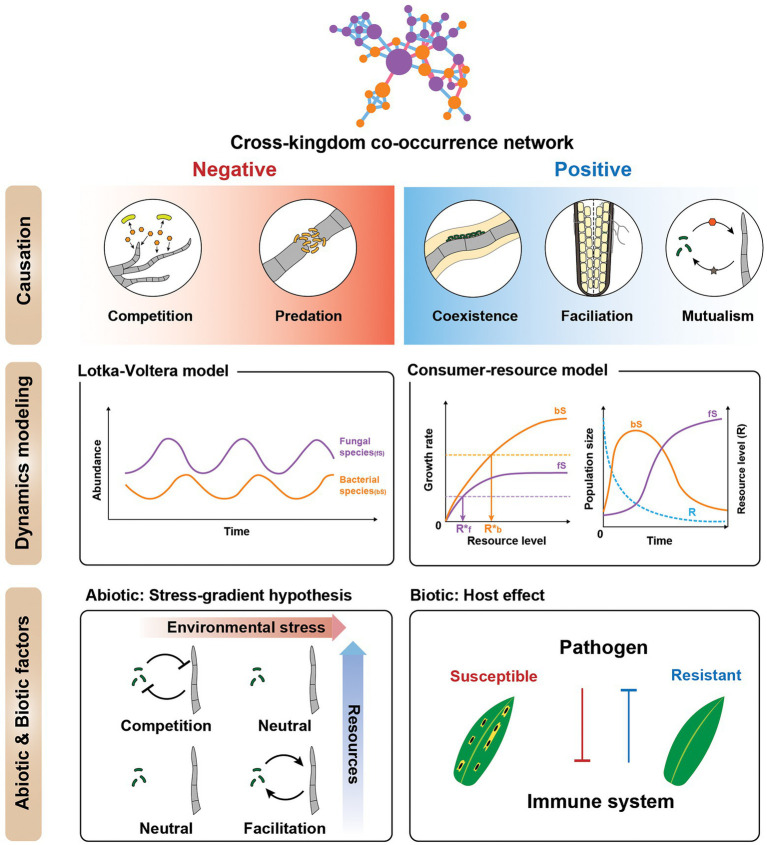
Microbial co-occurrence network analysis is being widely used for data exploration in plant microbiome research. Still, challenges lie in how well these microbial networks represent natural microbial communities and how well we can interpret and extract eco-evolutionary insights from the networks. Although many technical solutions have been proposed, in this perspective, we touch on the grave problem of kingdom-level bias in network representation and interpretation. We underscore the eco-evolutionary significance of using cross-kingdom (bacterial-fungal) co-occurrence networks to increase the network's representability of natural communities. To do so, we demonstrate how ecosystem-level interpretation of plant microbiome evolution changes with and without multi-kingdom analysis. Then, to overcome oversimplified interpretation of the networks stemming from the stereotypical dichotomy between bacteria and fungi, we recommend three avenues for ecological interpretation: (1) understanding dynamics and mechanisms of co-occurrence networks through generalized Lotka-Volterra and consumer-resource models, (2) finding alternative ecological explanations for individual negative and positive fungal-bacterial edges, and (3) connecting cross-kingdom networks to abiotic and biotic (host) environments.

Keywords: cross-kingdom interaction; ecological framework; fungi; network; plant microbiome.


Conflict of interest statement

The authors declare that the research was conducted in the absence of any commercial or financial relationships that could be construed as a potential conflict of interest.

Figures

Figure 1
Figure 1
Cross-kingdom networks and bacteria-only networks in wild and domesticated rice seed microbiomes. (A,B) Bacteria-only co-occurrence network of wild and domesticated rice seed microbiomes. (C,D) Cross-kingdom (bacterial-fungal) co-occurrence network of wild and domesticated rice-seed microbiomes. Orange nodes are bacterial nodes. Purple nodes are fungal nodes. The size of the node is proportionate to betweenness centrality. Blue edges are co-occurrence network edges with positive correlation coefficients. Red edges are co-occurrence network edges with negative correlation coefficients. (E) Change of betweenness centrality of the same bacterial nodes in the bacteria-only network (x-axis) and bacterial-fungal network (y-axis). (F) Change in eigenvector centrality of the same bacterial nodes from a bacteria-only network (x-axis) to a bacterial-fungal network (y-axis). The dashed line is y = x. Solid lines (red and blue) are regression curves using locally weighted smoothing (loess) to wild and domesticated nodes, respectively. The grey area next to the regression curves indicates a 95% CI.
Figure 2
Figure 2
Robustness analysis and connectance, transitivity, modularity, and nestedness of cross-kingdom and bacteria-only networks in wild and domesticated rice seed microbiomes. (A) Robustness analysis by in silico extinction experiments. Nodes were deleted from the network in order of degree, betweenness centrality, and eigenvector centrality, and randomly. The size of the largest component (y-axis) was recorded after every extinction event until all vertices were removed. For robustness curves, the fraction of nodes extinct and the fraction of the largest component size (largest component size after the attack ÷ largest component size before any extinction) were plotted on the x- and y-axes, respectively. (B) Area under the robustness curves for each attack order and network. (C) Z-score normalized connectance, transitivity, and modularity. Z-score normalization of summary statistics was carried out using the mean and SD of random configuration models (with the curveball method). Because the connectance of the random model had a standard deviation of 0, Z-score normalization was done by dividing by the mean of the random model. (D,E) Visualization of nestedness in wild and domesticated cross-kingdom co-occurrence networks. Rows are bacterial species and columns are fungal species. A red pixel denotes a link between bacterial and fungal species. Only edges connecting bacterial and fungal species were used to create the bipartite network.
Figure 3
Figure 3
Ecological interpretations of cross-kingdom co-occurrence networks. (Top) Cartoon illustrating ways to interpret individual negative and positive fungal-bacterial edges. Negative interactions include competition and predator–prey relationships, whereas positive interactions are cooperative, such as coexistence, facilitation, and mutualism. All positive and negative correlations are not cooperation and competition, respectively. (Middle) Dynamical modeling of co-occurrence networks using generalized Lotka-Volterra (gLV) and consumer-resource models. The cartoon depicts species dynamics related to the gLV and consumer-resource model, respectively (only for illustration purposes). These models can be used to supplement the network to elucidate the mechanism of the interactions. (Bottom) Effects of abiotic and biotic factors on cross-kingdom networks. To investigate cross-kingdom interactions in natural microbial communities, it is important to treat microbial interactions as variables dependent on the magnitude of stress, space, time (abiotic factors), and host (biotic factor). (Left) Stress gradient hypothesis—the relative importance of competitive vs. facilitative interactions varies along the environmental harshness gradient. Another consideration is the host effect (biotic factor). (Right) The host immune system mediates the interaction between the bacterial and fungal communities. The biotic factors influencing the microbial community can be affected by host plant pathogen susceptibility or resistance.

References

    1. Agler M. T., Ruhe J., Kroll S., Morhenn C., Kim S.-T., Weigel D., et al. . (2016). Microbial hub taxa link host and abiotic factors to plant microbiome variation. PLoS Biol. 14:e1002352. doi: 10.1371/journal.pbio.1002352, PMID: - DOI - PMC - PubMed
    1. Allesina S., Tang S. (2012). Stability criteria for complex ecosystems. Nature 483, 205–208. doi: 10.1038/nature10832, PMID: - DOI - PubMed
    1. Ballhausen M. B., de Boer W. (2016). The sapro-rhizosphere: carbon flow from saprotrophic fungi into fungus-feeding bacteria. Soil Biol. Biochem. 102, 14–17. doi: 10.1016/j.soilbio.2016.06.014 - DOI
    1. Ballhausen M. B., Veen J. A. V., Hundscheid M. P. J., de Boer W. (2015). Methods for baiting and enriching fungus-feeding (mycophagous) rhizosphere bacteria. Front. Microbiol. 6:1416. doi: 10.3389/fmicb.2015.01416, PMID: - DOI - PMC - PubMed
    1. Banerjee S., Kirkby C. A., Schmutter D., Bissett A., Kirkegaard J. A., Richardson A. E. (2016). Network analysis reveals functional redundancy and keystone taxa amongst bacterial and fungal communities during organic matter decomposition in an arable soil. Soil Biol. Biochem. 97, 188–198. doi: 10.1016/j.soilbio.2016.03.017 - DOI

LinkOut - more resources