The Original Form of C4-Photosynthetic Phospho enol pyruvate Carboxylase Is Retained in Pooids but Lost in Rice
- PMID: 35958195
- PMCID: PMC9358456
- DOI: 10.3389/fpls.2022.905894
The Original Form of C4-Photosynthetic Phospho enol pyruvate Carboxylase Is Retained in Pooids but Lost in Rice
Abstract
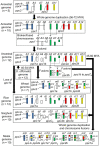
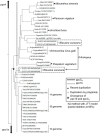
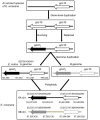
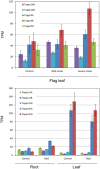
Poaceae is the most prominent monocot family that contains the primary cereal crops wheat, rice, and maize. These cereal species exhibit physiological diversity, such as different photosynthetic systems and environmental stress tolerance. Phosphoenolpyruvate carboxylase (PEPC) in Poaceae is encoded by a small multigene family and plays a central role in C4-photosynthesis and dicarboxylic acid metabolism. Here, to better understand the molecular basis of the cereal species diversity, we analyzed the PEPC gene family in wheat together with other grass species. We could designate seven plant-type and one bacterial-type grass PEPC groups, ppc1a, ppc1b, ppc2a, ppc2b, ppc3, ppc4, ppcC4, and ppc-b, respectively, among which ppc1b is an uncharacterized type of PEPC. Evolutionary inference revealed that these PEPCs were derived from five types of ancient PEPCs (ppc1, ppc2, ppc3, ppc4, and ppc-b) in three chromosomal blocks of the ancestral Poaceae genome. C4-photosynthetic PEPC (ppcC4 ) had evolved from ppc1b, which seemed to be arisen by a chromosomal duplication event. We observed that ppc1b was lost in many Oryza species but preserved in Pooideae after natural selection. In silico analysis of cereal RNA-Seq data highlighted the preferential expression of ppc1b in upper ground organs, selective up-regulation of ppc1b under osmotic stress conditions, and nitrogen response of ppc1b. Characterization of wheat ppc1b showed high levels of gene expression in young leaves, transcriptional responses under nitrogen and abiotic stress, and the presence of a Dof1 binding site, similar to ppcC4 in maize. Our results indicate the evolving status of Poaceae PEPCs and suggest the functional association of ppc1-derivatives with adaptation to environmental changes.
Keywords: Pooideae; abiotic stress; gene function and evolution; grass genome evolution; nitrate response; phosphoenolpyruvate carboxylase; positive selection; ppc1b.
Copyright © 2022 Yamamoto, Tong, Lv, Peng and Yang.
Conflict of interest statement
The authors declare that the research was conducted in the absence of any commercial or financial relationships that could be construed as a potential conflict of interest.
Figures





Similar articles
-
C4 Phosphoenolpyruvate Carboxylase: Evolution and transcriptional regulation.Genet Mol Biol. 2024 Mar 22;46(3 Suppl 1):e20230190. doi: 10.1590/1678-4685-GMB-2023-0190. eCollection 2024. Genet Mol Biol. 2024. PMID: 38517370 Free PMC article.
-
Phosphoenolpyruvate Carboxylase in Arabidopsis Leaves Plays a Crucial Role in Carbon and Nitrogen Metabolism.Plant Physiol. 2015 Mar;167(3):671-81. doi: 10.1104/pp.114.254474. Plant Physiol. 2015. PMID: 25588735 Free PMC article.
-
C4 Photosynthesis evolved in grasses via parallel adaptive genetic changes.Curr Biol. 2007 Jul 17;17(14):1241-7. doi: 10.1016/j.cub.2007.06.036. Epub 2007 Jul 5. Curr Biol. 2007. PMID: 17614282
-
Evolution of C4 phosphoenolpyruvate carboxylase.Arch Biochem Biophys. 2003 Jun 15;414(2):180-8. doi: 10.1016/s0003-9861(03)00165-6. Arch Biochem Biophys. 2003. PMID: 12781769 Review.
-
The remarkable diversity of plant PEPC (phosphoenolpyruvate carboxylase): recent insights into the physiological functions and post-translational controls of non-photosynthetic PEPCs.Biochem J. 2011 May 15;436(1):15-34. doi: 10.1042/BJ20110078. Biochem J. 2011. PMID: 21524275 Review.
Cited by
-
Leaf transcriptomes from C3, C3-C4 intermediate, and C4Neurachne species give insights into C4 photosynthesis evolution.Plant Physiol. 2024 Dec 23;197(1):kiae424. doi: 10.1093/plphys/kiae424. Plant Physiol. 2024. PMID: 39149860 Free PMC article.
References
-
- Bläsing O. E., Westhoff P., Svensson P. (2000). Evolution of C4 phosphoenolpyruvate carboxylase in Flaveria, a conserved serine residue in the carboxyl-terminal part of the enzyme is a major determinant for C4-specific characteristics. J. Biol. Chem. 275, 27917–27923. doi: 10.1074/jbc.M909832199, PMID: - DOI - PubMed
LinkOut - more resources
Full Text Sources

