

Induced pluripotent stem cell-derived smooth muscle cells to study cardiovascular calcification
- PMID: 35958427
- PMCID: PMC9357895
- DOI: 10.3389/fcvm.2022.925777
Induced pluripotent stem cell-derived smooth muscle cells to study cardiovascular calcification
Abstract
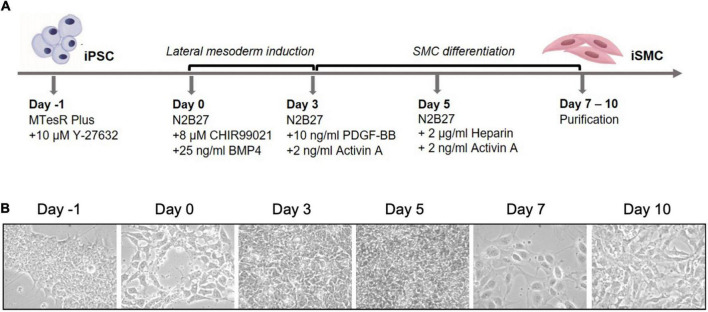
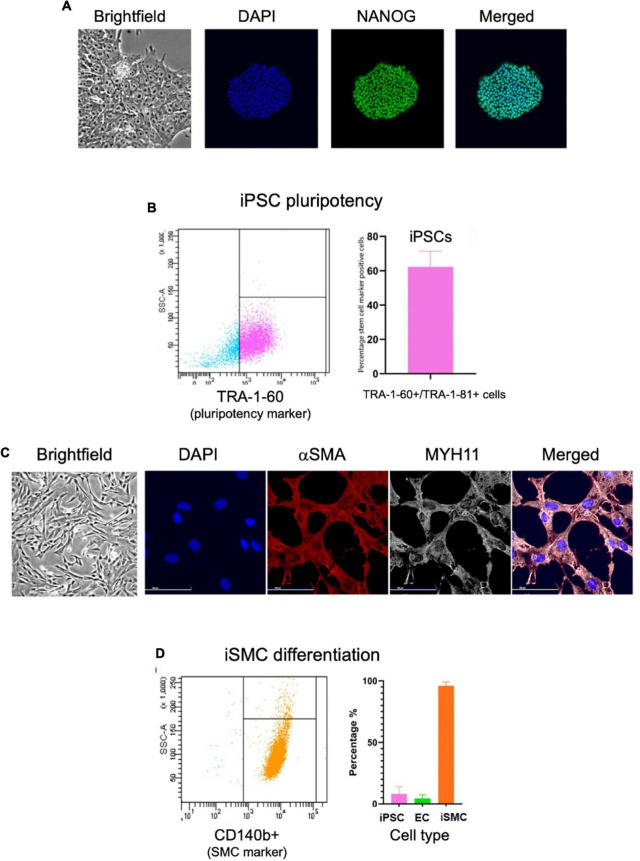
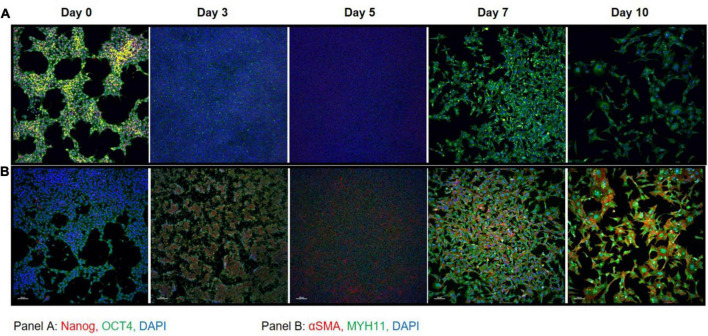
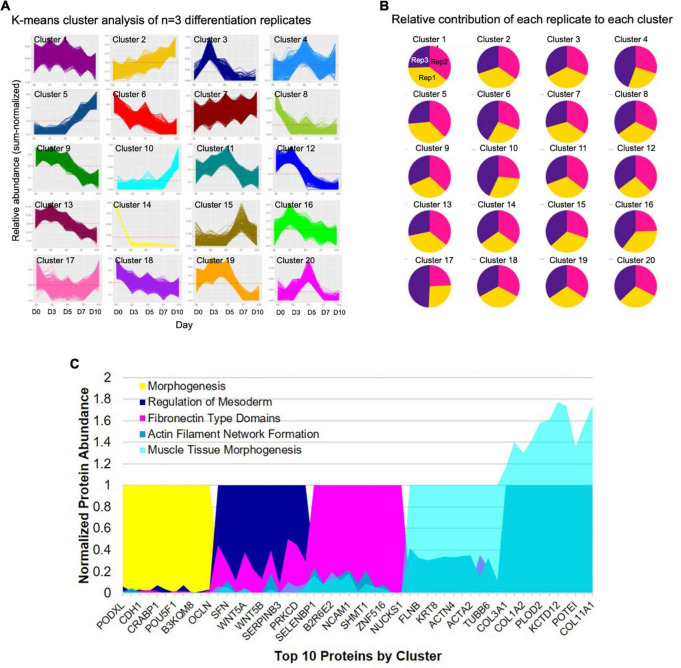
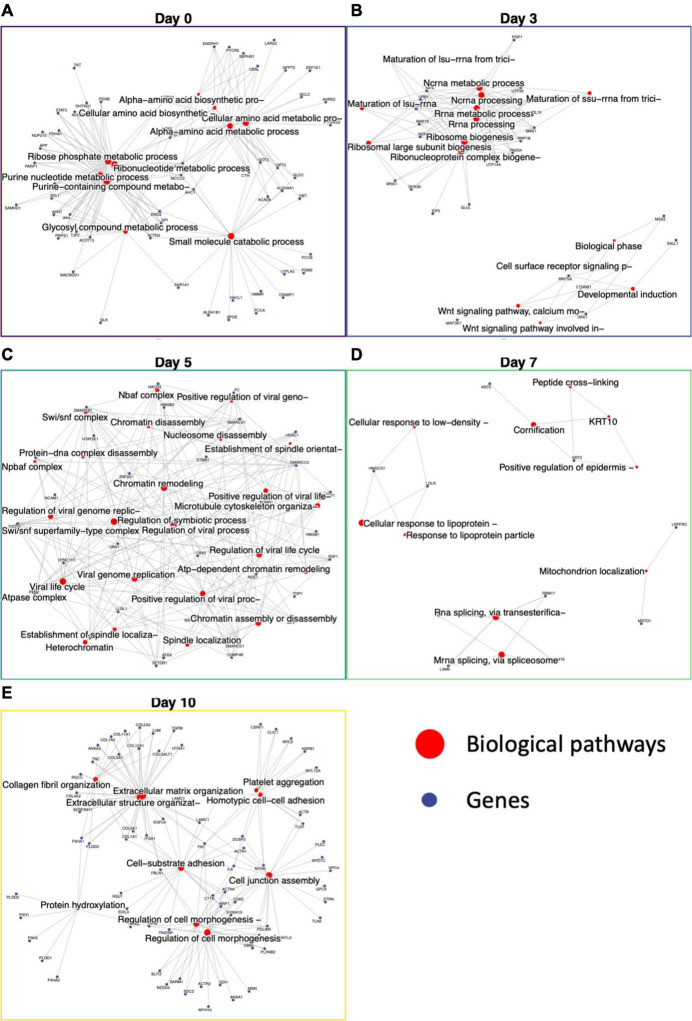
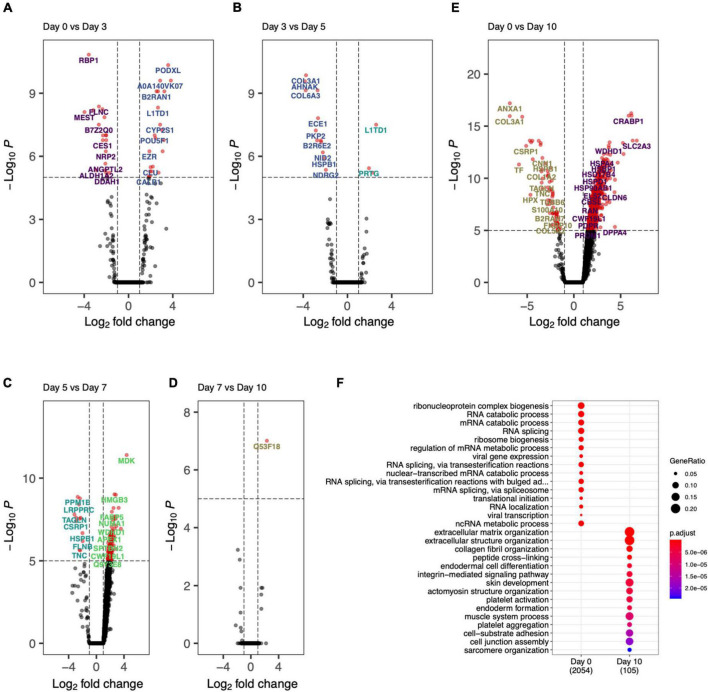
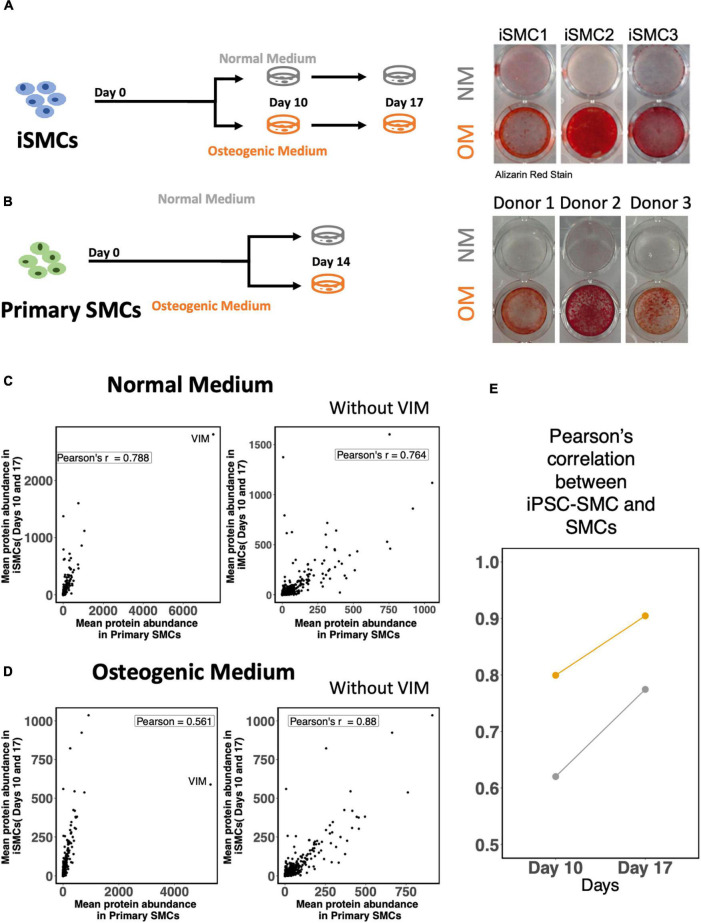
Cardiovascular calcification is the lead predictor of cardiovascular events and the top cause of morbidity and mortality worldwide. To date, only invasive surgical options are available to treat cardiovascular calcification despite the growing understanding of underlying pathological mechanisms. Key players in vascular calcification are vascular smooth muscle cells (SMCs), which transform into calcifying SMCs and secrete mineralizing extracellular vesicles that form microcalcifications, subsequently increasing plaque instability and consequential plaque rupture. There is an increasing, practical need for a large scale and inexhaustible source of functional SMCs. Here we describe an induced pluripotent stem cell (iPSC)-derived model of SMCs by differentiating iPSCs toward SMCs to study the pathogenesis of vascular calcification. Specifically, we characterize the proteome during iPSC differentiation to better understand the cellular dynamics during this process. First, we differentiated human iPSCs toward an induced-SMC (iSMC) phenotype in a 10-day protocol. The success of iSMC differentiation was demonstrated through morphological analysis, immunofluorescent staining, flow cytometry, and proteomics characterization. Proteomics was performed throughout the entire differentiation time course to provide a robust, well-defined starting and ending cell population. Proteomics data verified iPSC differentiation to iSMCs, and functional enrichment of proteins on different days showed the key pathways changing during iSMC development. Proteomics comparison with primary human SMCs showed a high correlation with iSMCs. After iSMC differentiation, we initiated calcification in the iSMCs by culturing the cells in osteogenic media for 17 days. Calcification was verified using Alizarin Red S staining and proteomics data analysis. This study presents an inexhaustible source of functional vascular SMCs and calcifying vascular SMCs to create an in vitro model of vascular calcification in osteogenic conditions, with high potential for future applications in cardiovascular calcification research.
Keywords: calcification; cardiovascular diseases; induced pluripotent stem cells; proteomics and bioinformatics; smooth muscle cells (SMCs); stem cell differentiation and reprogramming.
Copyright © 2022 Atkins, Sonawane, Brouwhuis, Barrientos, Ha, Rogers, Tanaka, Okui, Kuraoka, Singh, Aikawa and Aikawa.
Conflict of interest statement
The authors declare that the research was conducted in the absence of any commercial or financial relationships that could be construed as a potential conflict of interest.
Figures
Similar articles
-
Exposure of Induced Pluripotent Stem Cell-Derived Vascular Endothelial and Smooth Muscle Cells in Coculture to Hemodynamics Induces Primary Vascular Cell-Like Phenotypes.Stem Cells Transl Med. 2017 Aug;6(8):1673-1683. doi: 10.1002/sctm.17-0004. Epub 2017 Jun 19. Stem Cells Transl Med. 2017. PMID: 28628273 Free PMC article.
-
Genomic, Transcriptomic, and Proteomic Depiction of Induced Pluripotent Stem Cells-Derived Smooth Muscle Cells As Emerging Cellular Models for Arterial Diseases.Hypertension. 2023 Apr;80(4):740-753. doi: 10.1161/HYPERTENSIONAHA.122.19733. Epub 2023 Jan 19. Hypertension. 2023. PMID: 36655574
-
Do Induced Pluripotent Stem Cell Characteristics Correlate with Efficient In Vitro Smooth Muscle Cell Differentiation? A Comparison of Three Patient-Derived Induced Pluripotent Stem Cell Lines.Stem Cells Dev. 2018 Oct 15;27(20):1438-1448. doi: 10.1089/scd.2018.0031. Epub 2018 Aug 28. Stem Cells Dev. 2018. PMID: 30153084
-
MicroRNAs Regulate Vascular Medial Calcification.Cells. 2014 Oct 14;3(4):963-80. doi: 10.3390/cells3040963. Cells. 2014. PMID: 25317928 Free PMC article. Review.
-
Calcium deposition within coronary atherosclerotic lesion: Implications for plaque stability.Atherosclerosis. 2020 Aug;306:85-95. doi: 10.1016/j.atherosclerosis.2020.05.017. Epub 2020 Jun 14. Atherosclerosis. 2020. PMID: 32654790 Review.
Cited by
-
Dynamic three dimensional environment for efficient and large scale generation of smooth muscle cells from hiPSCs.Stem Cell Res Ther. 2024 Dec 3;15(1):463. doi: 10.1186/s13287-024-04053-z. Stem Cell Res Ther. 2024. PMID: 39627821 Free PMC article.
-
Use of iPSC-Derived Smooth Muscle Cells to Model Physiology and Pathology.Arterioscler Thromb Vasc Biol. 2024 Jul;44(7):1523-1536. doi: 10.1161/ATVBAHA.123.319703. Epub 2024 May 2. Arterioscler Thromb Vasc Biol. 2024. PMID: 38695171 Free PMC article. Review.
-
Identification of Disease-Relevant, Sex-Based Proteomic Differences in iPSC-Derived Vascular Smooth Muscle Cells.Int J Mol Sci. 2024 Dec 29;26(1):187. doi: 10.3390/ijms26010187. Int J Mol Sci. 2024. PMID: 39796045 Free PMC article.
-
Multiomics of Tissue Extracellular Vesicles Identifies Unique Modulators of Atherosclerosis and Calcific Aortic Valve Stenosis.Circulation. 2023 Aug 22;148(8):661-678. doi: 10.1161/CIRCULATIONAHA.122.063402. Epub 2023 Jul 10. Circulation. 2023. PMID: 37427430 Free PMC article.
-
Extracellular vesicles in atherosclerosis and vascular calcification: the versatile non-coding RNAs from endothelial cells and vascular smooth muscle cells.Front Med (Lausanne). 2023 Jul 4;10:1193660. doi: 10.3389/fmed.2023.1193660. eCollection 2023. Front Med (Lausanne). 2023. PMID: 37469665 Free PMC article. Review.
References
-
- Shaw LJ, Raggi P, Schisterman E, Berman DS, Callister TQ. Prognostic value of cardiac risk factors and coronary artery calcium screening for all-cause mortality. Radiology. (2003) 228:826–33. - PubMed
-
- Benjamin EJ, Muntner P, Alonso A, Bittencourt MS, Callaway CW, Carson AP, et al. Heart disease and stroke statistics-2019 update: a report from the American heart association. Circulation. (2019) 139:e56–528. - PubMed
LinkOut - more resources
Full Text Sources
Molecular Biology Databases