

An inflammatory response-related gene signature associated with immune status and prognosis of acute myeloid leukemia
- PMID: 35958446
- PMCID: PMC9360836
An inflammatory response-related gene signature associated with immune status and prognosis of acute myeloid leukemia
Abstract
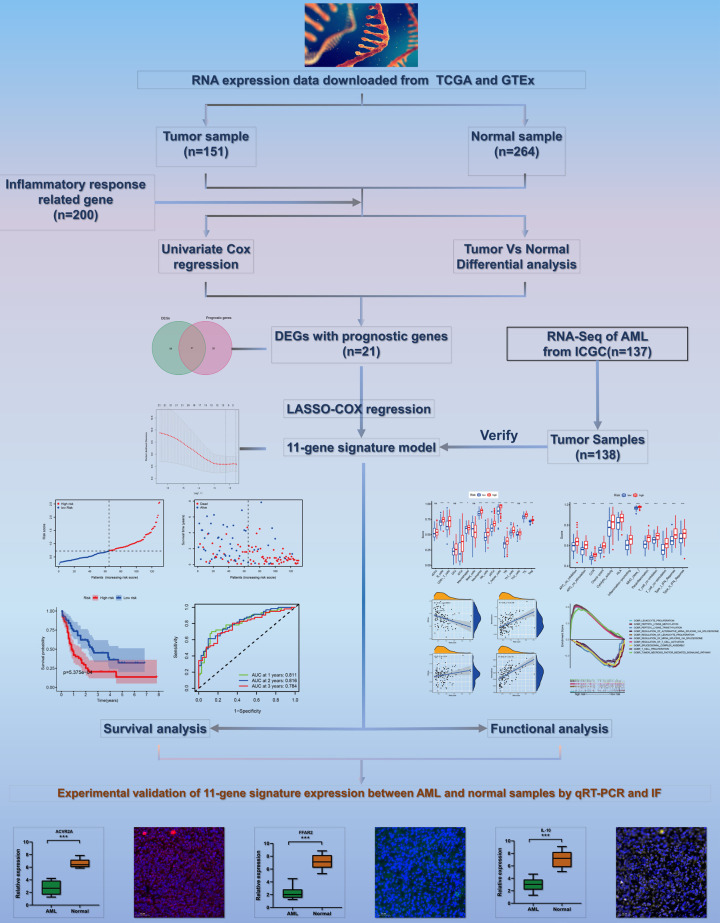
Objective: To determine the prognostic significance of inflammatory response-associated genes in acute myeloid leukemia (AML).
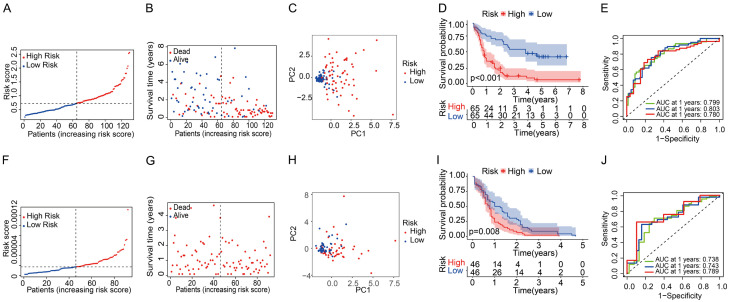
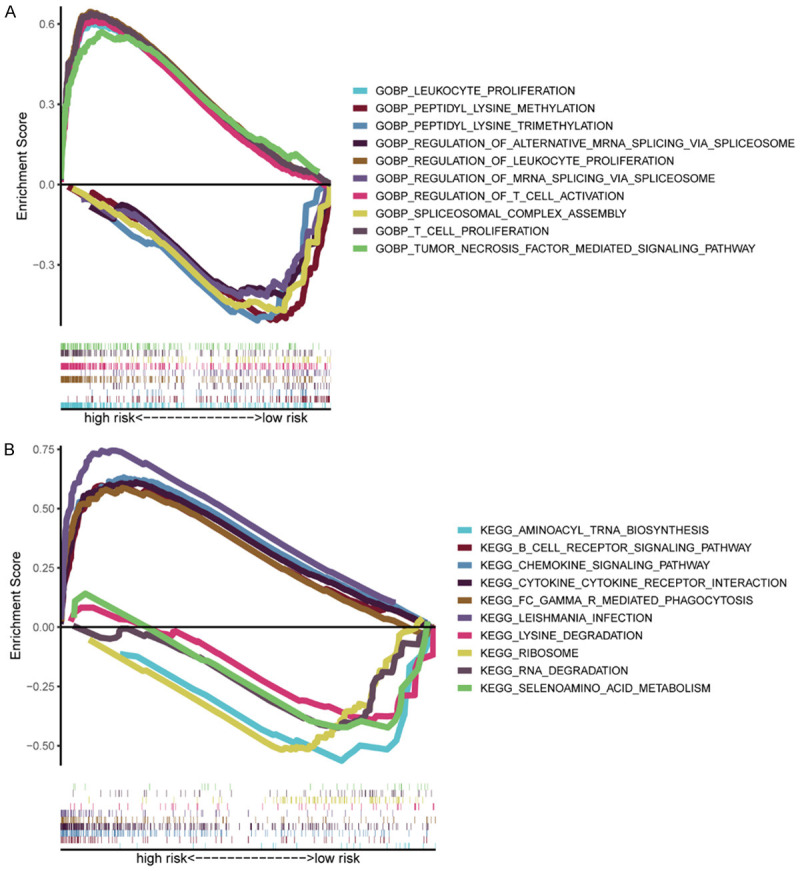
Methods: Transcriptomic profiles and related clinical information of AML patients were acquired from a public database. To establish a multi-gene prognosis signature, we performed least absolute shrinkage and selection operator Cox analysis for the TCGA cohort and evaluated the ICGC cohort for verification. Subsequently, Kaplan-Meier analysis was carried out to compare the overall survival (OS) rates between high- and low-risk groups. Biological function and single-sample gene set enrichment (ssGSEA) analyses were employed to investigate the association of risk score with immune status and the tumor microenvironment. Prognostic gene expression levels in AML samples and normal controls were confirmed by qRT-PCR and immunofluorescence.
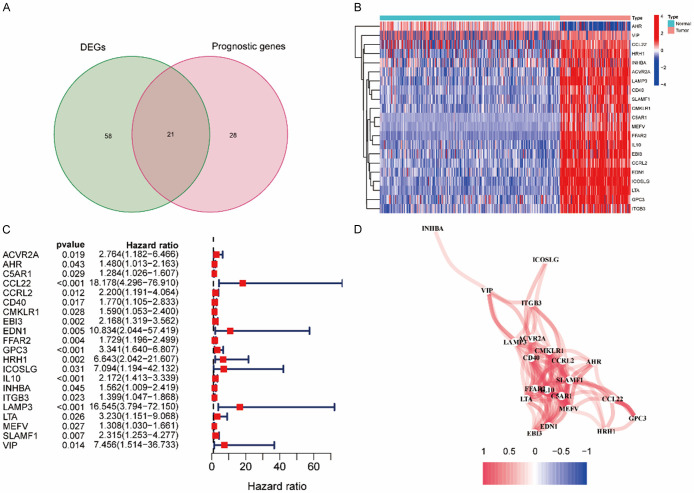
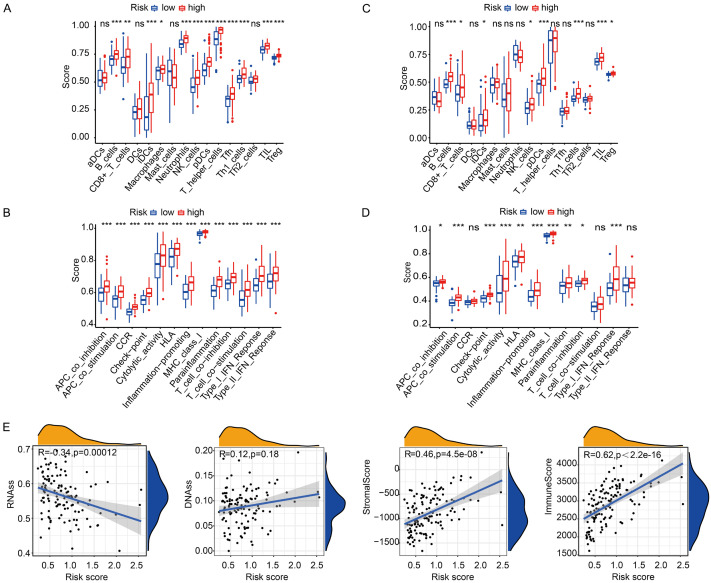
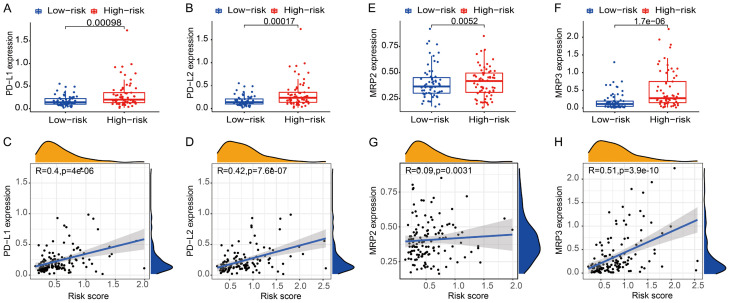
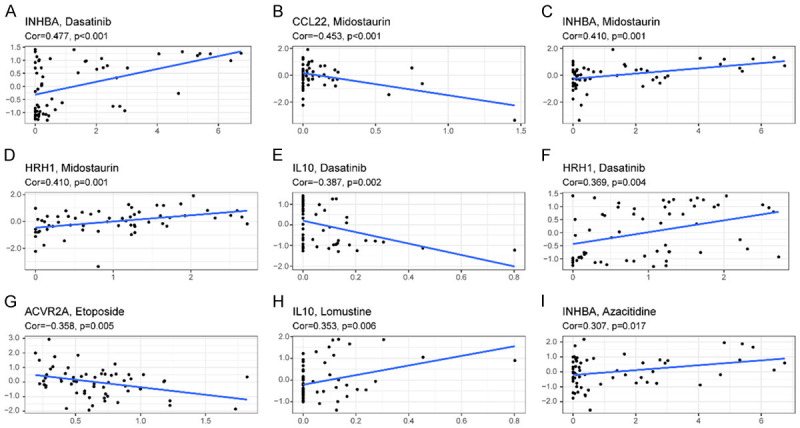
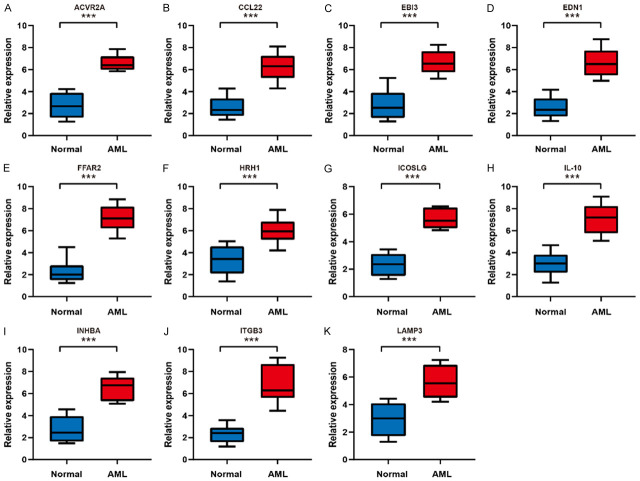
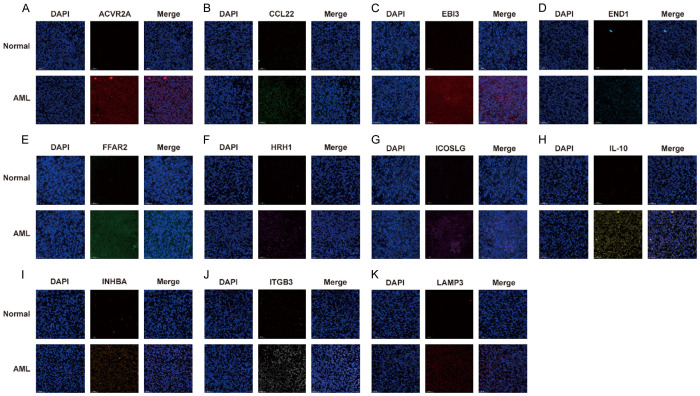
Results: We identified a potential inflammatory response-related signature comprising 11 differentially expressed genes, including ACVR2A, CCL22, EBI3, EDN1, FFAR2, HRH1, ICOSLG, IL-10, INHBA, ITGB3, and LAMP3, and found that AML patients with high expression levels in the high-risk group had poor OS rates. Biological function analyses revealed that prognostic genes mainly participated in inflammation and immunity signaling pathways. Analyses of cancer-infiltrating immunocytes indicated that in high-risk patients, the immune suppressive microenvironment was significantly affected. The expression of the inflammation reaction-associated signature was found to be associated with susceptibility to chemotherapy. There was a significant difference in prognostic gene expression between AML and control tissues.
Conclusion: A novel inflammatory response-related signature was developed with 11 candidate genes to predict prognosis and immune status in AML patients.
Keywords: Acute myeloid leukemia; drug sensitivity; immune status; inflammatory response; overall survival; prognostic gene signature; tumor microenvironment.
AJTR Copyright © 2022.
Conflict of interest statement
None.
Figures
Similar articles
-
An Inflammatory Response-Related Gene Signature Can Impact the Immune Status and Predict the Prognosis of Hepatocellular Carcinoma.Front Oncol. 2021 Mar 22;11:644416. doi: 10.3389/fonc.2021.644416. eCollection 2021. Front Oncol. 2021. PMID: 33828988 Free PMC article.
-
Development and Validation of an Inflammatory Response-Related Gene Signature for Predicting the Prognosis of Pancreatic Adenocarcinoma.Inflammation. 2022 Aug;45(4):1732-1751. doi: 10.1007/s10753-022-01657-6. Epub 2022 Mar 23. Inflammation. 2022. PMID: 35322324
-
A transient receptor potential channel-related model based on machine learning for evaluating tumor microenvironment and immunotherapeutic strategies in acute myeloid leukemia.Front Immunol. 2022 Dec 16;13:1040661. doi: 10.3389/fimmu.2022.1040661. eCollection 2022. Front Immunol. 2022. PMID: 36591215 Free PMC article.
-
An Intratumor Heterogeneity-Related Signature for Predicting Prognosis, Immune Landscape, and Chemotherapy Response in Colon Adenocarcinoma.Front Med (Lausanne). 2022 Jul 7;9:925661. doi: 10.3389/fmed.2022.925661. eCollection 2022. Front Med (Lausanne). 2022. PMID: 35872794 Free PMC article.
-
Construction of a Pyroptosis-Related Signature for Prognostic Prediction and Characterization of Immune Microenvironment in Acute Myelogenous Leukemia.Int J Gen Med. 2022 Mar 12;15:2913-2927. doi: 10.2147/IJGM.S352062. eCollection 2022. Int J Gen Med. 2022. PMID: 35308573 Free PMC article.
Cited by
-
Advanced nanoparticles that can target therapy and reverse drug resistance may be the dawn of leukemia treatment: A bibliometrics study.Front Bioeng Biotechnol. 2022 Oct 10;10:1027868. doi: 10.3389/fbioe.2022.1027868. eCollection 2022. Front Bioeng Biotechnol. 2022. PMID: 36299285 Free PMC article.
-
Clinical Aspects and Significance of β-Chemokines, γ-Chemokines, and δ-Chemokines in Molecular Cancer Processes in Acute Myeloid Leukemia (AML) and Myelodysplastic Neoplasms (MDS).Cancers (Basel). 2024 Sep 24;16(19):3246. doi: 10.3390/cancers16193246. Cancers (Basel). 2024. PMID: 39409868 Free PMC article. Review.
-
Malignant behaviors and immune response in melanoma: Epstein-Barr virus induced gene 3 as a therapeutic target based on an in-vitro exploration.PeerJ. 2024 Dec 23;12:e18730. doi: 10.7717/peerj.18730. eCollection 2024. PeerJ. 2024. PMID: 39726752 Free PMC article.
-
Immune cells regulate matrix metalloproteinases to reshape the tumor microenvironment to affect the invasion, migration, and metastasis of pancreatic cancer.Am J Transl Res. 2022 Dec 15;14(12):8437-8456. eCollection 2022. Am J Transl Res. 2022. PMID: 36628243 Free PMC article.
-
Pretreatment Pan-Immune-Inflammation Value (PIV) in Predicting Therapeutic Response and Clinical Outcomes of Neoadjuvant Immunochemotherapy for Esophageal Squamous Cell Carcinoma.Ann Surg Oncol. 2024 Jan;31(1):272-283. doi: 10.1245/s10434-023-14430-2. Epub 2023 Oct 14. Ann Surg Oncol. 2024. PMID: 37838648
References
-
- Siegel RL, Miller KD, Jemal A. Cancer statistics, 2020. CA Cancer J Clin. 2020;70:7–30. - PubMed
LinkOut - more resources
Full Text Sources
Research Materials
Miscellaneous