. 2022 Jul 15;14(7):4931-4947.
eCollection 2022.

A signature based on m6A pattern and tumor microenvironment infiltration in clear cell renal cell carcinoma

Affiliations

A signature based on m6A pattern and tumor microenvironment infiltration in clear cell renal cell carcinoma

Chen Yang et al. Am J Transl Res. .

Abstract

Background: RNA N6-methyladenosine (m6A) has been found to have a critical impact on clear cell renal cell carcinoma (ccRCC) by affecting the tumor microenvironment (TME) and immune cell (IC) infiltration and is related to the treatment and survival rate of patients with ccRCC. However, the mechanism of m6A in TME and IC infiltration remained unclear.

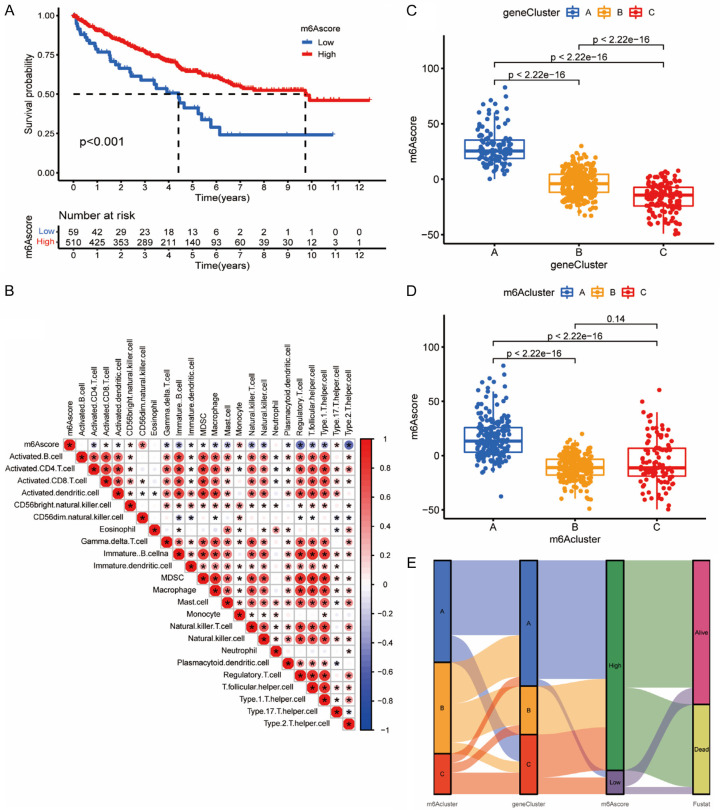
Methods: Nonnegative Matrix Factorization (NMF) clustering was performed on 650 ccRCC cases from the Cancer Genome Atlas (TCGA) and the Gene-Expression Omnibus (GEO) datasets. The immune infiltration was generated by the single-sample gene-set enrichment analysis (ssGSEA) algorithm. Survival analyses were performed using the Kaplan-Meier method, and the significance of the differences was determined using the log-rank test. The m6A score was constructed based on the expression of m6A regulators to quantify m6A modification. The package "survminer R" was employed to layer patients' low and high scores groups and predict the immunotherapy response.

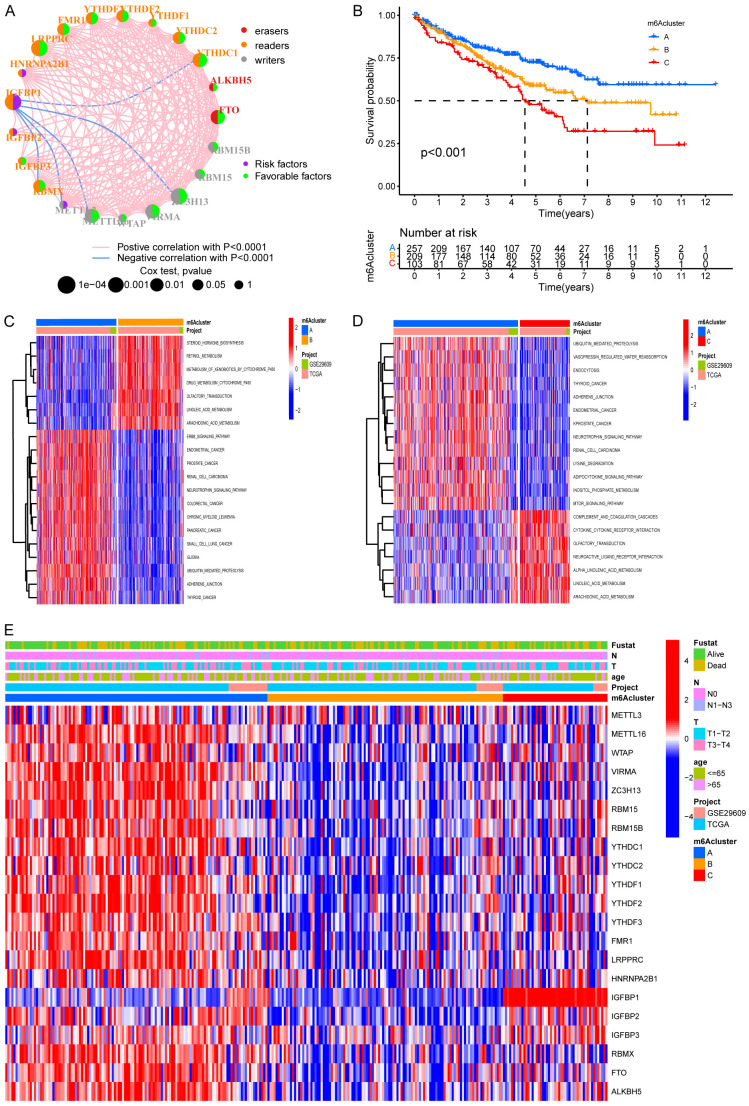
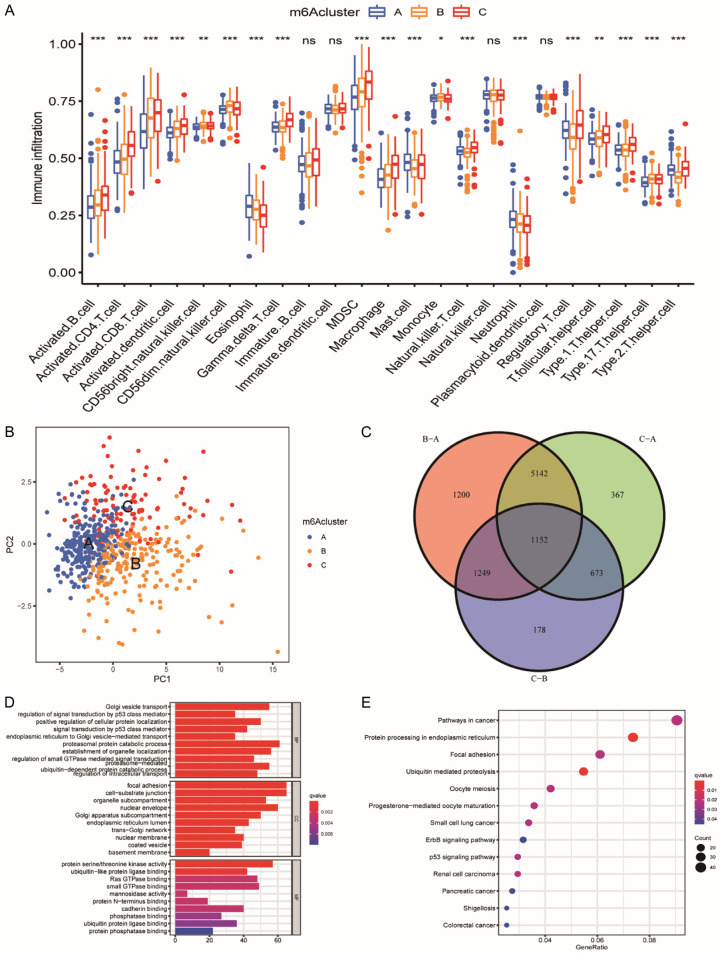
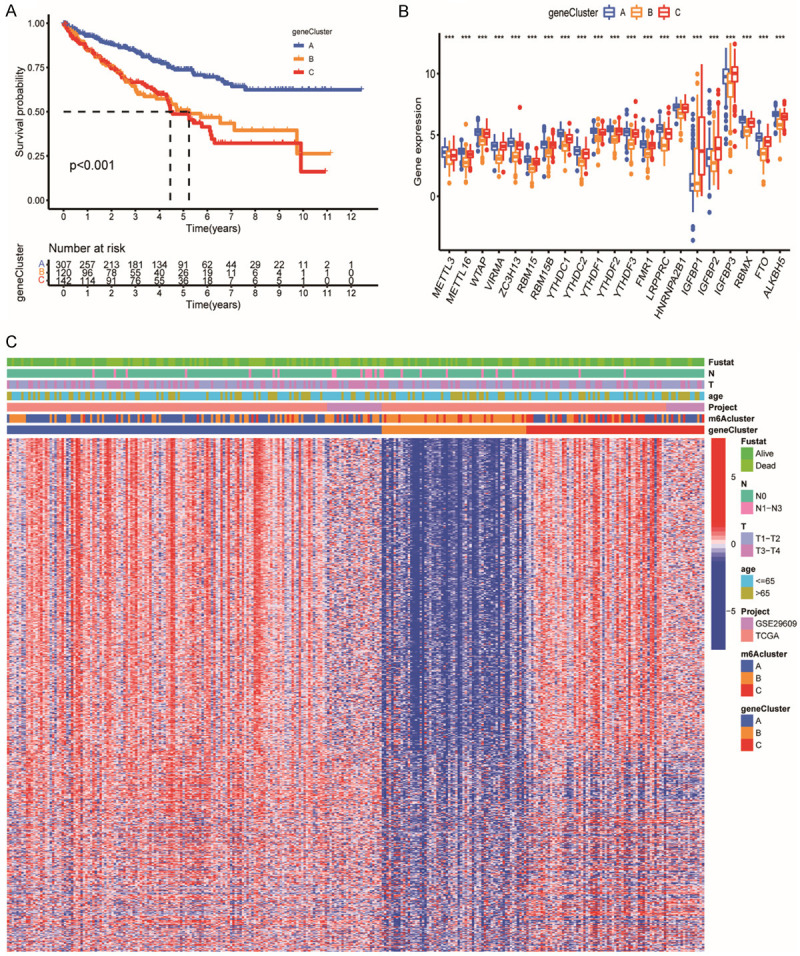
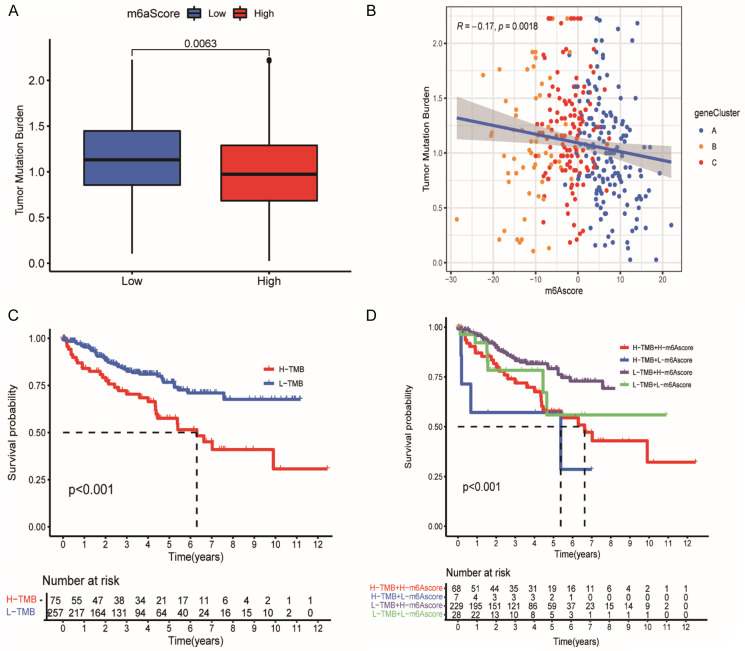
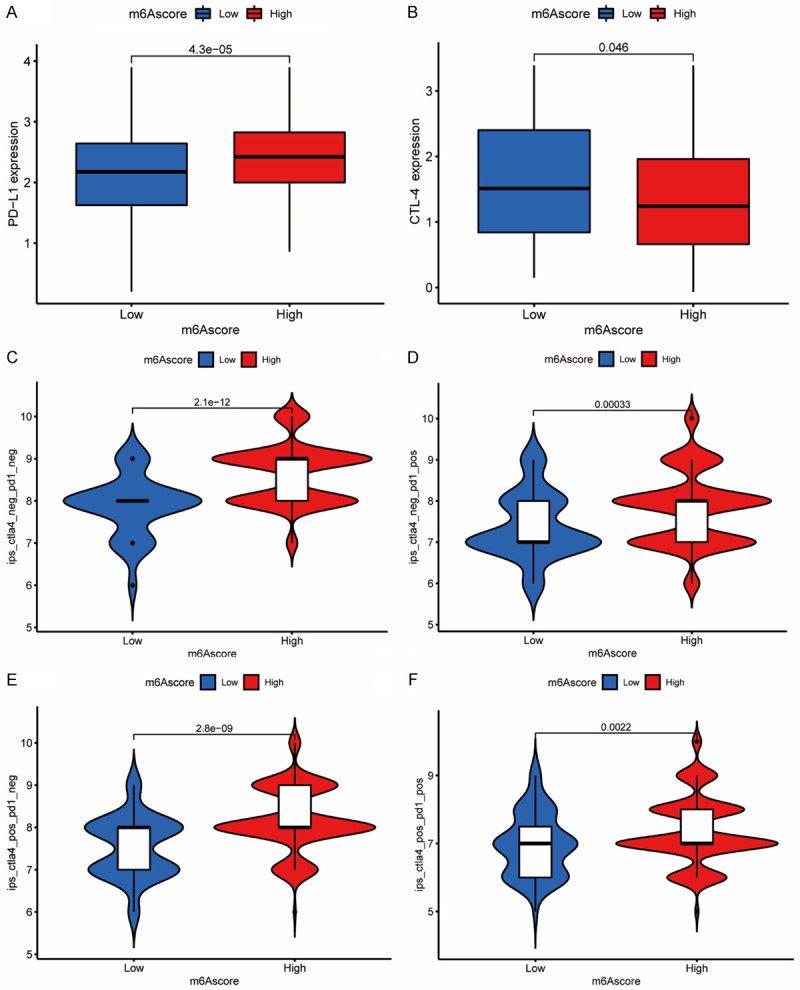
Results: Three different patterns of m6A modification were established, and significant differences in TME and IC infiltration features were found in these three patterns. Survival analysis demonstrated that m6A cluster A and m6A gene cluster A experienced a longer survival time. Evaluation of m6A modification patterns in individual tumors was initiated by the m6A score. The low m6A score subtype was characterized by increased tumor mutation burden (TMB) and immune infiltration, whereas a high m6A score with a lack of immune cell infiltration showed significantly better overall survival. m6A score was also associated with the expression of programmed cell death protein 1 (PD-L1) and cytotoxic T lymphocyte antigen 4 (CTLA-4). Patients in the high m6A score group had high PD-L1 expression and low CTLA-4 expression. Significant differences in prognosis were identified among types of different TMB and m6A scores, where low TMB and high m6A score had longer survival time.

Conclusions: This research indicated that m6A modification greatly affected TME and IC infiltration. Physicians can develop practical immunotherapy strategies for patients with ccRCC by evaluating m6A-associated genes.

Keywords: ccRCC; immunotherapy; m6A; tumor microenvironment; tumor mutation burden.


Conflict of interest statement

None.

Figures

Figure 1
Figure 1
Landscape of genetic variation of m6A regulators in ccRCC. A. The modification frequency of 23 m6A regulators in 336 ccRCC patients from the TCGA-KIRC dataset. Each column represents a patient. The upper bar diagram represents TMB. The bar diagram on the right shows the proportion of the individual variation types. The number on the right represents the mutation frequency of each regulator. The following stacked bar diagram indicates the proportion of transformation of each sample. B. The location of CNV alteration of m6A regulators on 23 chromosomes from TCGA-KIRC dataset. C. The expression of 23 m6A regulators between normal tissues and ccRCC tissues. Red represents tumor and blue represents normal. The top and bottom of the boxes represent maximum to minimum values. Black dots represent outliers. Lines in the boxes show the median value. The asterisks represent the statistical P value (*P<0.05; **P<0.01; ***P<0.001). D. The frequency of CNV alteration in m6A regulators from TCGA-KIRC dataset. The length of each column shows the alteration frequency. The green dots represent deletion and the red dots represent amplification.
Figure 2
Figure 2
Biological characteristics of distinct m6A modification. A. The correlation between m6A regulators in ccRCC. The lines linking regulators showed their interactions and red represent positive correlation while blue represents negative correlation. The erasers, readers and writers are colored red, orange, and grey, respectively. Green and purple dots in the circle represent protective and risk factors respectively the size of each circle represented the statistical P-value with P<0.0001, P<0.001, P<0.01, and P<0.05, respectively. B. Survival analyses of the three m6A clusters including 257 cases in pattern A, 209 cases in pattern B and 103 cases in pattern C (P<0.001). Blue for m6A cluster A, yellow for m6A cluster B and red for m6A cluster C. The number of alive patients along with time in three clusters is at the bottom of the picture. Kaplan-Meier curves show significant survival differences among the three m6A modification patterns, while m6A cluster A exhibited a significant survival advantage among the three clusters. C, D. Activation of biologic pathways analysis in three m6A clusters with GSVA. The heatmap is a visualization of these biological processes. Red, activated pathways; blue, inhibited pathways. C. m6A cluster A vs. m6A cluster B. D. m6A cluster A vs. m6A cluster C. E. Visualization of patients’ characteristics and m6A regulators in distinct m6A clusters. In the heatmap, red represents increased expression of m6A regulator; and blue represents decreased expression of m6A regulator.
Figure 3
Figure 3
TME cell infiltration characteristics and transcriptome traits in three m6A clusters. A. Immune cells of TME infiltration of distinct m6A clusters. The top and bottom of the boxes represent maximum to minimum values. Black dots represent outliers. Lines in the boxes show the median value. The asterisks represent the statistical P-value (*P<0.05; **P<0.01; ***P<0.001). B. Transcriptome analysis of distinct m6A clusters with PCA. Blue for m6A cluster A, yellow for m6A cluster B and red for m6A cluster C. C. Venn diagram of DEGs. There were 1152 DEGs between the three m6A gene patterns in ccRCC. D. GO enrichment analysis of m6A-related genes. The color depth of the bar plots represents the number of genes enriched. The length of the frame bar represents the count of enriched genes in the pathway and the color represents the q value. E. KEGG pathway analysis of DEGs. The size of the circles represents the count of enriched genes in each pathway and the color represents the q value.
Figure 4
Figure 4
Construction of m6A phenotype-related genes clusters. A. Survival analyses of the three m6A clusters including 307 cases in gene cluster A, 120 cases in gene cluster B and 142 cases in gene cluster C (P<0.001). Blue for m6A gene cluster A, yellow for m6A gene cluster B and red for m6A gene cluster C. The number of alive patients and time in three clusters is at the bottom of the picture. B. Immune cells of TME infiltrating of distinct m6A gene clusters. The top and bottom of the boxes represent maximum to minimum values. Black dots represented outliers. Lines in the boxes show the median value. The asterisks represent the statistical P value (*P<0.05; **P<0.01; ***P<0.001). C. Visualization of patients’ characteristics and m6A-related genes in distinct m6A gene clusters. The gene clusters, m6A clusters, project types, age, tumor stage, histology and survival status were used as patient annotations. In the heatmap, red represent increased expression of m6A-related genes; blue represent decreased expression of m6A-related genes.
Figure 5
Figure 5
Biological features of m6A score. A. Survival analyses of distinct m6A score groups. Blue for low m6A score and red for high m6A score. Patients with higher m6A score exhibited significantly better survival times than the lower group (P<0.001). B. Correlations between m6A score and immune cells. A square with “*” represents a significant correlation and its color represents the coefficient. Negative correlation is marked with blue and positive correlation with red. C. Differences in m6A score among different m6A gene clusters. The top and bottom of the boxes represent maximum to minimum values. Black dots represent outliers. Lines in the boxes show the median value. There were significant differences among the different m6A gene clusters (P<0.0001). D. Differences in m6Ascore between different m6A clusters. Significant differences were found between m6A clusters A and C and m6A cluster A and B (P<0.0001, Kruskal-Wallis test). E. Alluvial diagram showing the changes in m6A cluster, gene cluster, m6A score and survival status.
Figure 6
Figure 6
Characteristics of m6 A score and tumor mutation burden in ccRCC. A. Differences in TMB between two m6A score groups. The top and bottom of the boxes represent maximum to minimum values. Black dots represent outliers. Lines in the boxes show the median value. Blue, low m6A score; red, high m6A score. B. Quantitative relationship between m6A score and TMB. Abscissa represents m6A score and ordinate represents TMB. There was a negative correlation between m6A score and TMB (R=-0.17, P=0.0018). C. Survival analyses for distinct TMB groups using Kaplan-Meier curves. H, high; L, Low; (P<0.001, Log-rank test). D. Survival analyses for different TMB and different m6A scores using Kaplan-Meier curves. H, high; L, Low; (P<0.001, Log-rank test).
Figure 7
Figure 7
m6A score in the role of immunotherapy in ccRCC. A. Differences in PD-L1 expression between low and high m6A score groups (P<0.0001, Wilcoxon test). B. Differences in CTLA-4 expression between low and high m6A score groups (P<0.0001, Wilcoxon test). C-F. Differences in immunophenoscore between different m6A score groups (P<0.0001, Wilcoxon test). C. Differences in negative CTLA-4 and negative PD-1 group between different m6A score groups. D. Differences in negative CTLA-4 and positive PD-1 group between different m6A score groups. E. Differences in positive CTLA-4 and negative PD-1 group between different m6A score groups. F. Differences in positive CTLA-4 and positive PD-1 group between different m6A score groups.

Similar articles

Cited by

References

    1. Jonasch E, Walker CL, Rathmell WK. Clear cell renal cell carcinoma ontogeny and mechanisms of lethality. Nat Rev Nephrol. 2021;17:245–261. - PMC - PubMed
    1. Williamson SR. Clear cell papillary renal cell carcinoma: an update after 15 years. Pathology. 2021;53:109–119. - PubMed
    1. Wettersten HI, Aboud OA, Lara PN Jr, Weiss RH. Metabolic reprogramming in clear cell renal cell carcinoma. Nat Rev Nephrol. 2017;13:410–419. - PubMed
    1. Siegel RL, Miller KD, Jemal A. Cancer statistics, 2020. CA Cancer J Clin. 2020;70:7–30. - PubMed
    1. Jonasch E, Gao J, Rathmell WK. Renal cell carcinoma. BMJ. 2014;349:g4797. - PMC - PubMed

LinkOut - more resources