

Serum sphingosine-1 phosphate level is increased in patients with hepatitis B and displays a positive association with liver fibrosis
- PMID: 35958454
- PMCID: PMC9360858
Serum sphingosine-1 phosphate level is increased in patients with hepatitis B and displays a positive association with liver fibrosis
Abstract
Objective: To investigate the difference in serum sphingosine-1 phosphate (S1P) concentration between the HBV hepatitis patients and healthy controls, and its relevant association with serum liver fibrosis indicators.
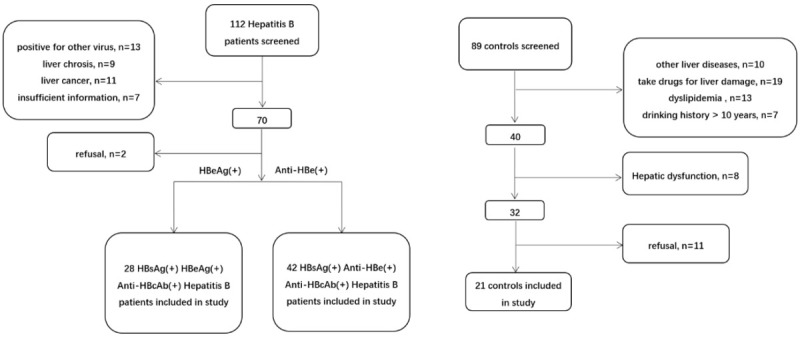
Methods: A total of 28 HBsAg (+) HBeAg (+) Anti-HBc (+) hepatitis B patients, 42 HBsAg (+) Anti-HBe (+) Anti-HBc (+) hepatitis B patients, and 21 healthy subjects with normal liver function were included. Liquid chromatography-tandem mass method was used to detect the level of serum S1P.
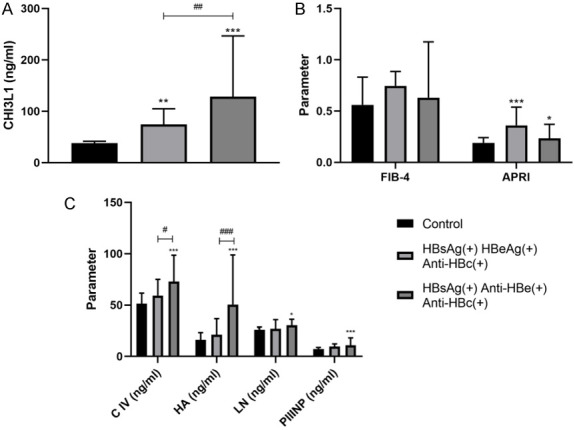
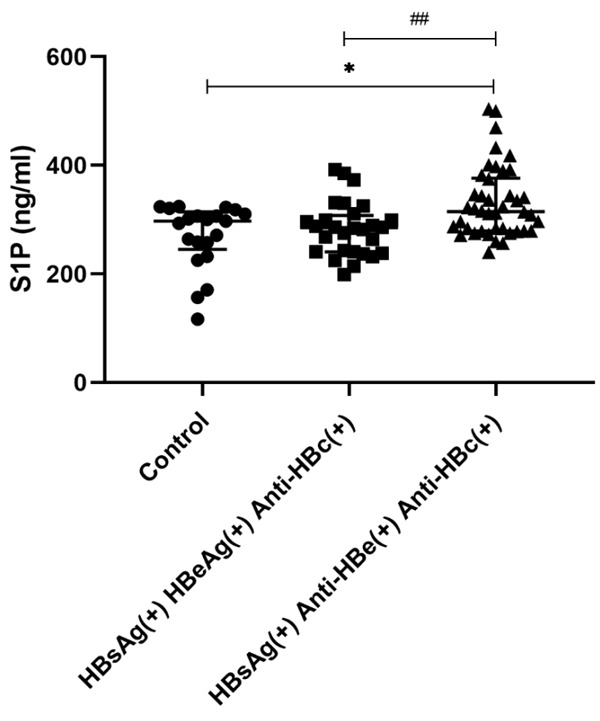
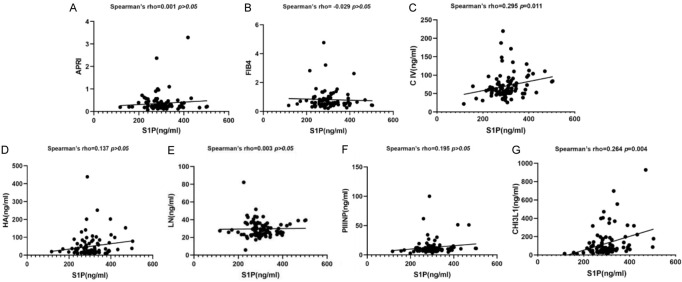
Results: SerumS1P concentration of Anti-HBe (+) hepatitis B patients was higher than that of the control group (P=0.017) and HBeAg (+) patients (P=0.007). At the same time, there was no significant difference in the serum S1P concentration between HBeAg (+) hepatitis B patients and the control group (P>0.05). Moreover, serum S1P concentration was positively correlated with liver fibrosis indices, Collage Type IV Protein (r=0.264; P=0.011), and Chitosanase 3-like protein 1 (r=0.295; P=0.004).
Conclusions: Serum S1P level is increased in patients with hepatitis B and displays a positive association with liver fibrosis.
Keywords: Hepatitis B; chitosanase 3-like protein 1; collagen type IV protein; hepatic fibrosis; sphingosine 1-phosphate.
AJTR Copyright © 2022.
Conflict of interest statement
None.
Figures
Similar articles
-
Correlations between serum hepatitis B surface antigen and hepatitis B core antibody titers and liver fibrosis in treatment-naïve CHB patients.J Chin Med Assoc. 2018 Dec;81(12):1052-1059. doi: 10.1016/j.jcma.2018.05.007. Epub 2018 Aug 22. J Chin Med Assoc. 2018. PMID: 30143430
-
Serum hepatitis B core antibody titer use in screening for significant fibrosis in treatment-naïve patients with chronic hepatitis B.Oncotarget. 2017 Feb 14;8(7):11063-11070. doi: 10.18632/oncotarget.14323. Oncotarget. 2017. PMID: 28052021 Free PMC article.
-
New assays for quantitative determination of viral markers in management of chronic hepatitis B virus infection.J Clin Microbiol. 1992 May;30(5):1111-9. doi: 10.1128/jcm.30.5.1111-1119.1992. J Clin Microbiol. 1992. PMID: 1583107 Free PMC article.
-
Serum vitamin D and vitamin-D-binding protein levels in children with chronic hepatitis B.World J Gastroenterol. 2021 Jan 21;27(3):255-266. doi: 10.3748/wjg.v27.i3.255. World J Gastroenterol. 2021. PMID: 33519140 Free PMC article.
-
Chronic hepatitis B virus infection in Asian countries.J Gastroenterol Hepatol. 2000 Dec;15(12):1356-61. doi: 10.1046/j.1440-1746.2000.0150121356.x. J Gastroenterol Hepatol. 2000. PMID: 11197043 Review.
Cited by
-
Critical Roles of the Sphingolipid Metabolic Pathway in Liver Regeneration, Hepatocellular Carcinoma Progression and Therapy.Cancers (Basel). 2024 Feb 20;16(5):850. doi: 10.3390/cancers16050850. Cancers (Basel). 2024. PMID: 38473211 Free PMC article. Review.
References
-
- Pellicoro A, Ramachandran P, Iredale JP, Fallowfield JA. Liver fibrosis and repair: immune regulation of wound healing in a solid organ. Nat Rev Immunol. 2014;14:181–194. - PubMed
-
- Ott JJ, Stevens GA, Groeger J, Wiersma ST. Global epidemiology of hepatitis B virus infection: new estimates of age-specific HBsAg seroprevalence and endemicity. Vaccine. 2012;30:2212–2219. - PubMed
-
- Hannun YA, Obeid LM. Principles of bioactive lipid signalling: lessons from sphingolipids. Nat Rev Mol Cell Biol. 2008;9:139–150. - PubMed
LinkOut - more resources
Full Text Sources
Research Materials