. 2022 Jul 15;14(7):4532-4548.
eCollection 2022.

Bioinformatics evaluation of a novel angiogenesis related genes-based signature for predicting prognosis and therapeutic efficacy in patients with gastric cancer

Affiliations

Bioinformatics evaluation of a novel angiogenesis related genes-based signature for predicting prognosis and therapeutic efficacy in patients with gastric cancer

Ning Ma et al. Am J Transl Res. .

Abstract

Objective: Tumor angiogenesis plays a pivotal role in the development and metastasis of tumors. This study aimed to elucidate the association between angiogenesis-related genes (ARGs) and the prognosis of patients with gastric cancer (GC).

Methods: Transcriptomics and clinical data of GC samples were obtained from The Cancer Genome Atlas (TCGA) as the training group and those from Gene Expression Omnibus (GEO, including GSE26253, GSE26091 and GSE66229) as the validation groups. Single-sample gene set enrichment analysis (ssGSEA) was performed for gene set enrichment analysis on the gene set of angiogenesis and divided patients into high- or low-ARG group. Subsequently, to improve the availability of the ARG signature, a ARGs subtype predictor was then constructed by integrating of four machine learning methods, including support vector machine (SVM), least absolute shrinkage and selection operator (LASSO) regression, Random Forest and Boruta (RFB) and extreme gradient boosting (XGBoost). Kaplan-Meier and receiver operating characteristic curves were used to evaluate the performance of prognosis prediction. The EPIC and xCELL method were used to calculate the profile of tumor-infiltrated immune cells.

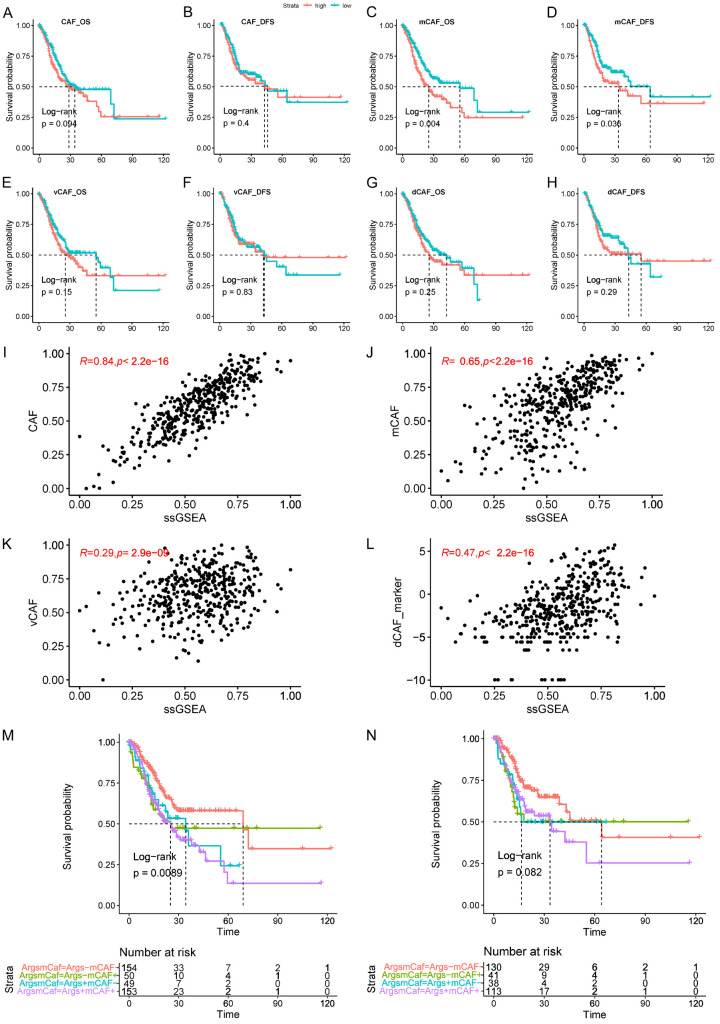
Results: The expression levels of a total of 36 ARGs that correlated with the survival of patients with GC were identified and utilized to establish an ARG-related prognosis signature. The area under the curve for predicting overall survival (OS) in the training group at the 1-, 3- and 5-year was 0.61, 0.64 and 0.76, respectively, and this was further validated using three independent GEO datasets. Moreover, the ARG signatures were significantly correlated with cancer-associated fibroblasts (CAFs), and GC patients that exhibited both high ARG expression level and matrix CAFs level had the most inferior outcomes. The multiple machine learning algorithms were applied to establish a 10-gene ARG subtype predictor, and notably, a high ARG-subtype predictor score was associated with reduced efficacy of immunotherapy, and potential anti-HER2 or FGFR4 therapy, but an increased sensitivity to anti-angiogenesis-related therapy.

Conclusion: The novel ARGs-based classification may act as a potential prognostic predictor for GC and be used as a guidance for clinicians in selecting potential responders for immunotherapy and targeted therapy.

Keywords: Angiogenesis; TCGA; cancer-associated fibroblasts; gastric cancer; immune cell infiltration; immunotherapy.


Conflict of interest statement

None.

Figures

Figure 1
Figure 1
The identification and prognostic analysis of the candidate angiogenesis-related genes in the TCGA cohort. A: The heatmap of the 36 angiogenesis-related genes’ expression in gastric cancer tissues. B: The distribution and median value of the ssGSEA scores in the TCGA cohort (up panel). The distribution of OS, OS status, and risk score in the TCGA cohort (middle panel). The distribution of DFS, DFS status, and risk score in the TCGA cohort. C: The Kaplan-Meier curves for the OS of patients in the TCGA cohort, which was divided into high- and low-ARG group. D: The Kaplan-Meier curves for the DFS of patients in the TCGA cohort, which was divided into high-risk group and low-risk group. E: ROC (Receiver operating characteristic) curves showing the 1-, 3-, and 5-year OS and DFS predictive efficiency of the ARGs-signature in the TCGA cohorts. F: The analyses of clinical features between high- and low-ARGs prognosis score groups in GC cohort. ARG: angiogenesis-related genes; OS: overall survival; DFS: disease-free survival; ROC: receiver operating characteristic.
Figure 2
Figure 2
The correlation analysis between ARG score and survival in gastric cancer patients. A: Independent prognostic factors for overall survival (OS) and disease-free survival (DFS) in gastric cancer patients. Univariate and multivariate Cox regression analysis was used to identify the relationship between clinicopathological features (including the risk score) and OS and DFS of patients in the training group. B: Stratified analysis of the correlation between ARG score and survival rate (OS and DFS) of patients with gastric cancer in the training group based on different clinical feature, including neoplasm disease stage (Stage I-II and stage II-III), neoplasm disease grade (G1-2 and G3), tumor stage (T1-2 and T3-4), lymph node metastasis stage (N0 and N1-3), long distant metastasis (M0 and M1).
Figure 3
Figure 3
Tumor microenvironment related to ARG score in GC samples from the TCGA dataset. (A) Spearman’s rank order correlation between ARG score and ICG, CYT, HLA, ESTIMATE, TIL. (B) The correlation analysis of ARG score and tumor purity. (C and D) Comparison of abundance of immune cells between high- and low-ARG group by EPIC (C) and XCELL (D). CYT: cytolytic activity score; HLA: human leukocyte antigens; ICG: immune checkpoint gene; TIL: tumor-infiltrated lymphocyte.
Figure 4
Figure 4
Survival analysis of different ARGs and CAFs subgroups. The Kaplan-Meier curves was used for analyzing the OS and DFS of patients in the TCGA cohort, which was divided into high and low CAF density groups (A, B), mCAF (C, D), vCAF (E, F), dCAF (G, H). Spearman’s rank order correlation between ARGs and CAFs including total CAF (I, R=0.84, P=2.2e-16), mCAF (J, R=0.64, P=8e-14), vCAF (K, R=0.31, P=0.00089), dCAF (L, R=0.52, P=5.4e-09). Kaplan-Meir curve of the OS (M) and DFS (N) according to the ARGs signature score and mCAFs contents. CAF: cance-associated fibroblasts; vascular CAF: vCAF; mCAF: matrix CAF; dCAF: developmental CAF.
Figure 5
Figure 5
The prognostic performance of ARG score in the three validation sets. Kaplan-Meier curves of overall survival and disease-free survival of the GSE26901 (A), GSE26253 (B), and GSE66229 (C) cohort.
Figure 6
Figure 6
Construction and validation of a ARGs subtype predictor. (A) Principal component analysis (PCA) of the two clusters (cluster 1 and 2) in the TCGA cohort. (B) A Venn diagram of different expression genes of different clusters. The Kaplan-Meier curves for the OS (C) and DFS (D) of patients in the TCGA cohort, which was divided into cluster 1 and cluster 2 group. (E) Comparison of the immune score, stromal score, and ESTIMATE score between cluster 1 and cluster 2. (F) The expression level of TIM3 in the two clusters. Comparison of the contents of infiltrating immune cells between cluster 1 and cluster 2 was conducted by ESTIMATE (G) and XCELL (H). (I) A 10 most critical subtype specific genes were identified by Venn diagram, which were shared by four feature selection algorithms. ROC curves of the subtype predictor in distinguishing two subtypes in the train set (J) and test set (K). Kaplan-Meier survival analysis also suggested that patients’ OS and PFS were significantly different between Subtype I and II both in GSE26901 (L and M) cohort. ROC curves showing the 1-, 3-, and 5-year OS (N) and DFS (O) predictive efficiency of the ARGs-signature in the GSE26901 cohort. Kaplan-Meier survival analysis also suggested that OS and PFS of patients were markedly different between Subtype I and II both in GSE66229 cohort (P, Q). (J, K) ROC curves showing the 1-, 3-, and 5-year OS (R) and DFS (S) predictive efficiency of the ARGs-signature in the GSE66229 cohort. ROC: Receiver operating characteristic; OS: overall survival; DFS: disease-free survival.
Figure 7
Figure 7
Identification of molecular characteristics related to risk score, and association analysis between the ARGs score and immunotherapy or targeted therapy. (A) The comparison of recurrence percentage of the GC patients. (B) The comparison of the four different ARGs types including MSI, TP53 positive, TP53 negative and EMT in GSE66229. (C) Differences in risk score among different TCGA-STAD molecular subtypes. The upper and lower ends of the boxes represented interquartile range of values. The lines in the boxes represented median value. The Kruskal-Wallis test was used to compare the statistical difference in risk score among five molecular subtypes. (D and E) The waterfall plot of tumor genetic mutation established by those with high risk score (D) and low risk score (E). Each column indicates individual patients. The upper bar plot showed TMB, and the number on the right indicated the mutation frequency in each gene. The right bar plot showed the proportion of each variant type. (F) Kaplan-Meier curves of overall survival according to ARGs score subtypes in the IMvigor210 cohort. (G) Boxplot illustrating the distribution of ARGs score for patients with different anti-PD-L1 immunotherapy responses in the IMvigor210 cohort. Significance was determined by the Wilcoxon test. SD, stable disease; PD, progressive disease; CR, complete response; PR, partial response. (H) The correlation between mutation counts, FGFR4, HER2 and ARGs score. (I) The difference in the IC50 of sunitinib, sorafenib, pazopanib and axitinib between samples with high- or low-risk score. TMB: tumor mutation burden; IC50: half-maximal inhibitory concentration.

Similar articles

Cited by

References

    1. Smyth EC, Nilsson M, Grabsch HI, van Grieken NC, Lordick F. Gastric cancer. Lancet. 2020;396:635–648. - PubMed
    1. Serra O, Galán M, Ginesta MM, Calvo M, Sala N, Salazar R. Comparison and applicability of molecular classifications for gastric cancer. Cancer Treat Rev. 2019;77:29–34. - PubMed
    1. Cheong JH, Wang SC, Park S, Porembka MR, Christie AL, Kim H, Kim HS, Zhu H, Hyung WJ, Noh SH, Hu B, Hong C, Karalis JD, Kim IH, Lee SH, Hwang TH. Development and validation of a prognostic and predictive 32-gene signature for gastric cancer. Nat Commun. 2022;13:774. - PMC - PubMed
    1. Wang J, Kunzke T, Prade VM, Shen J, Buck A, Feuchtinger A, Haffner I, Luber B, Liu DHW, Langer R, Lordick F, Sun N, Walch A. Spatial metabolomics identifies distinct tumor-specific subtypes in gastric cancer patients. Clin Cancer Res. 2022;21:4383. - PubMed
    1. Carmeliet P. Angiogenesis in life, disease and medicine. Nature. 2005;438:932–936. - PubMed

LinkOut - more resources