. 2022 Jul 25:13:954077.
doi: 10.3389/fimmu.2022.954077. eCollection 2022.

HTLV-1 intragenic viral enhancer influences immortalization phenotype in vitro, but is dispensable for persistence and disease development in animal models

Affiliations

HTLV-1 intragenic viral enhancer influences immortalization phenotype in vitro, but is dispensable for persistence and disease development in animal models

Victoria Maksimova et al. Front Immunol. .

Abstract

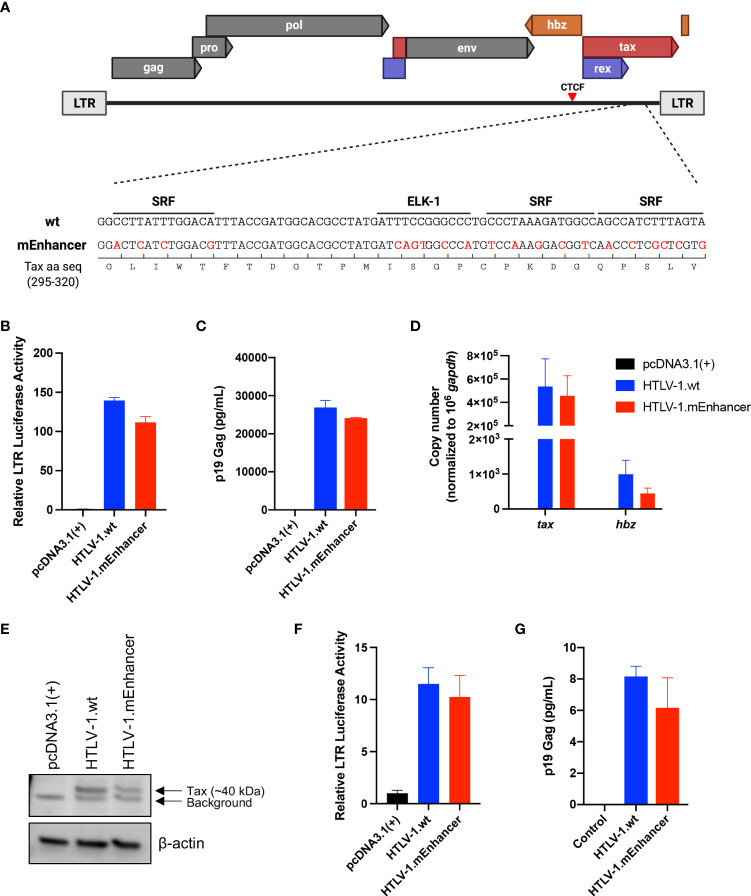
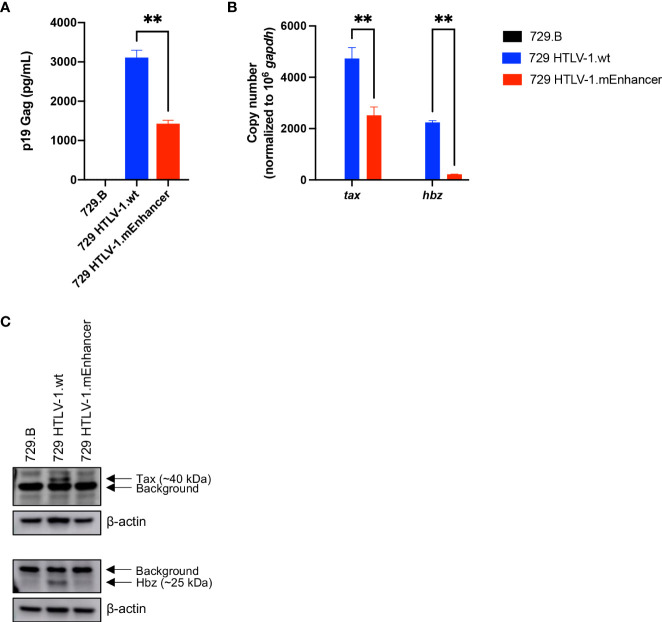
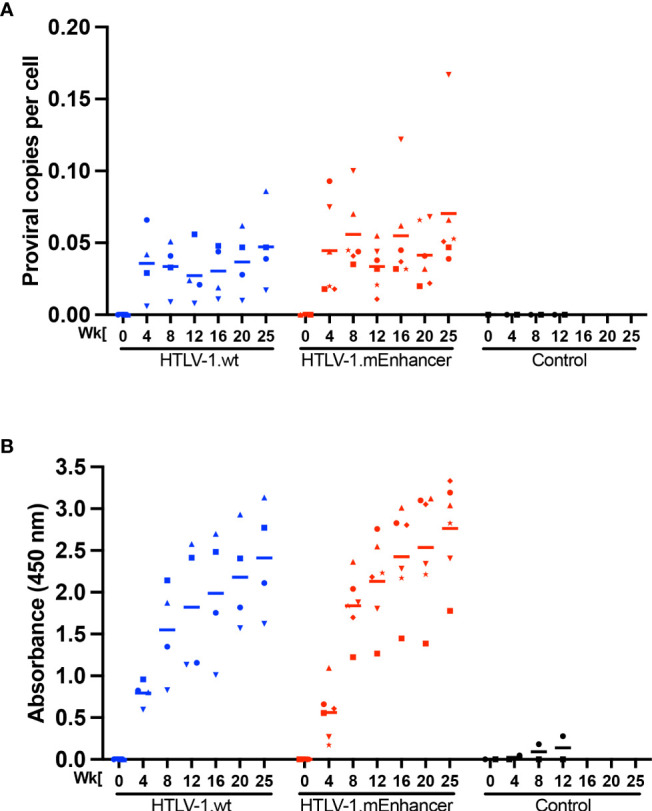
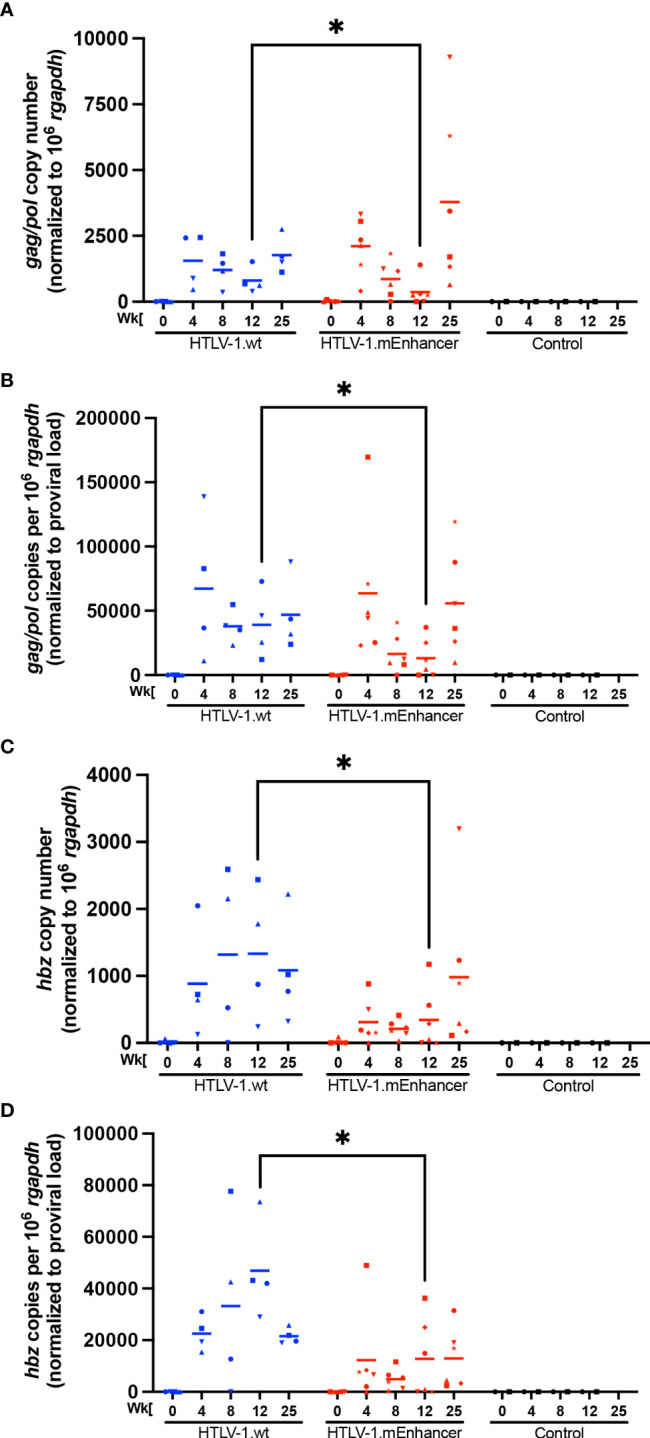
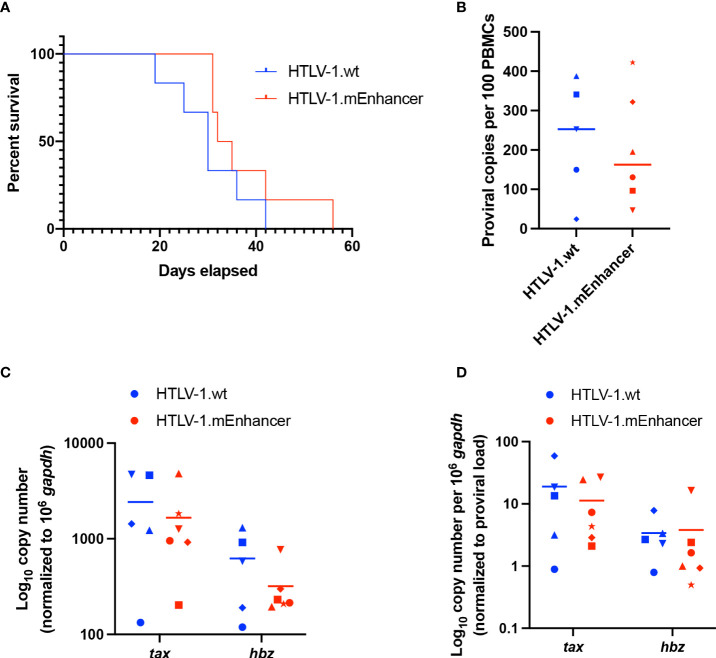
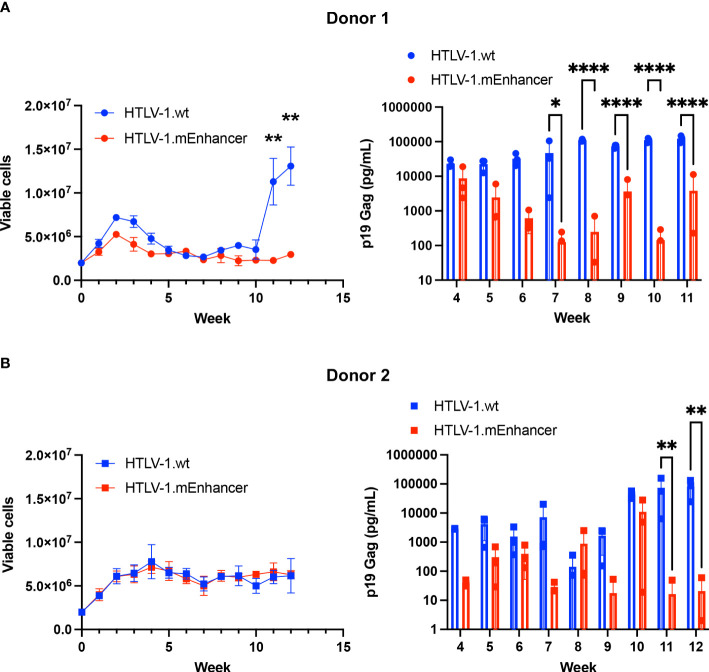
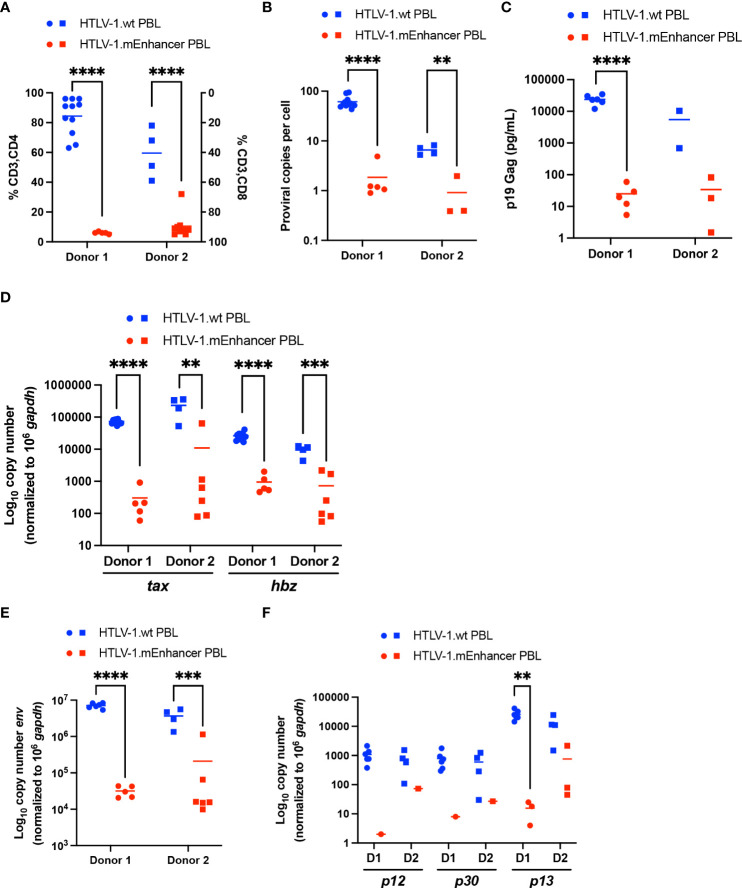
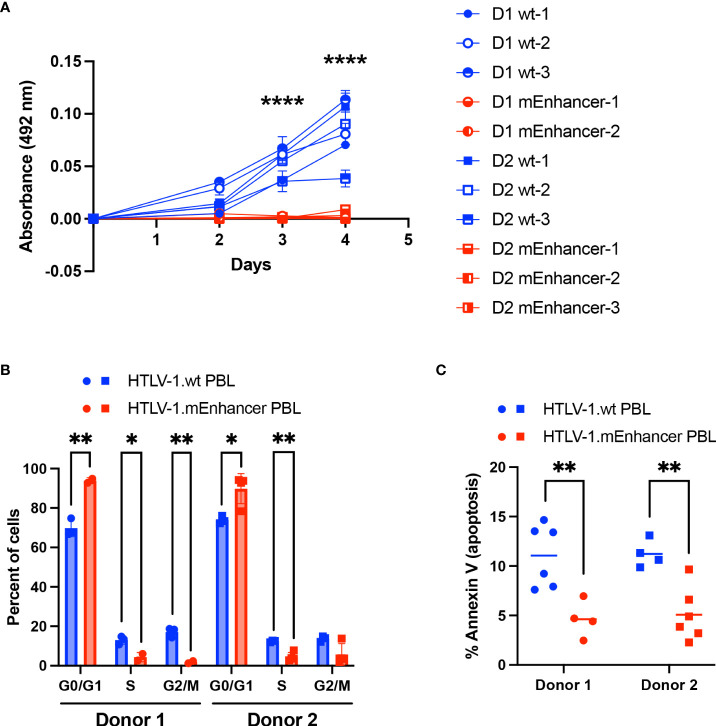
Human T-cell leukemia virus type 1 (HTLV-1) is the causative infectious agent of adult T-cell leukemia/lymphoma (ATL) and chronic neurological disease. The disparity between silenced sense transcription versus constitutively active antisense (Hbz) transcription from the integrated provirus is not fully understood. The presence of an internal viral enhancer has recently been discovered in the Tax gene near the 3' long terminal repeat (LTR) of HTLV-1. In vitro, this enhancer has been shown to bind SRF and ELK-1 host transcription factors, maintain chromatin openness and viral gene transcription, and induce aberrant host gene transcription near viral integration sites. However, the function of the viral enhancer in the context of early HTLV-1 infection events remains unknown. In this study, we generated a mutant Enhancer virus (mEnhancer) and evaluated its effects on HTLV-1-mediated in vitro immortalization, establishment of persistent infection with an in vivo rabbit model, and disease development in a humanized immune system (HIS) mouse model. The mEnhancer virus was able to establish persistent infection in rabbits, and there were no significant differences in proviral load or HTLV-1-specific antibody responses over a 25-week study. However, rabbits infected with the mEnhancer virus had significantly decreased sense and antisense viral gene expression at 12-weeks post-infection. HIS mice infected with wt or mEnhancer virus showed similar disease progression, proviral load, and viral gene expression. While mEnhancer virus was able to sufficiently immortalize primary T-lymphocytes in cell culture, the immortalized cells had an altered phenotype (CD8+ T-cells), decreased proviral load, decreased sense and anti-sense gene expression, and altered cell cycle progression compared to HTLV-1.wt immortalized cells (CD4+ T-cells). These results suggest that the HTLV-1 enhancer element alone does not determine persistence or disease development but plays a pivotal role in regulating viral gene expression.

Keywords: HTLV-1; enhancer; immortalization; persistence; retrovirus; transcription.


Conflict of interest statement

The authors declare that the research was conducted in the absence of any commercial or financial relationships that could be construed as a potential conflict of interest.

Figures

Figure 1
Figure 1
Generation and characterization of HTLV-1.mEnhancer proviral clone in vitro. The mEnhancer region was cloned into the HTLV-1 proviral plasmid ACHneo by overlap extension PCR. (A) Alignment of the mEnhancer region and the wild-type region from the HTLV-1 molecular clone ACHneo. Mutations span the consensus binding sequences for the transcription factors SRF and ELK-1. (B) HEK293T cells were co-transfected with the pcDNA3.1(+) empty vector, HTLV-1.wt, or mutant (HTLV-1.mEnhancer) proviral plasmid, an HTLV-1 LTR-firefly luciferase construct, and a TK-Renilla luciferase construct. 72h post-transfection, cells and supernatant were collected for dual luciferase assay and ELISA to detect HTLV-1 p19 Gag (C), respectively. Relative LTR luciferase activity was determined by normalizing firefly luciferase relative light units to Renilla, and the empty vector control was set as 1. Each condition was performed in duplicate. (D) RNA was extracted from transfected cells for cDNA synthesis, followed by qPCR to detect tax and hbz mRNA levels. Copy number is shown normalized to 1 x 10⁶ gapdh copies. (E) Cells pellets from transfected cells were lysed and total protein was quantified by BCA assay. Equivalent amounts of protein were subjected to SDS-PAGE and immunoblotting to detect Tax expression. β-actin was used as a loading control. Arrows are used to distinguish bands representative of Tax protein expression from background. (F) The HTLV-1-negative T-cell line, Jurkat, was co-transfected with the pcDNA3.1(+) empty vector, HTLV-1.wt, or mutant (HTLV-1.mEnhancer) proviral plasmid, an HTLV-1 LTR-firefly luciferase construct, and a TK-Renilla luciferase construct. 72h post-transfection, cells and supernatant were collected for dual luciferase assay and ELISA to detect HTLV-1 p19 Gag (G), respectively. Relative LTR luciferase activity was determined as described above. Each condition was performed in duplicate. Graphs represent data generated from duplicate samples and error bars represent standard deviation (SD). Statistical significance was determined by unpaired t test.
Figure 2
Figure 2
Generation and characterization of HTLV-1.mEnhancer producer cells. HTLV-1.wt and HTLV-1.mEnhancer producer cells were generated by nucleofecting 729.B parental cells with proviral plasmid DNA. After G418 selection and limiting dilution, (A) supernatant was collected from single cell clones for p19 Gag ELISA. Only one clone with sufficient virion production compared to HTLV-1.wt was selected for additional experiments and analyses. Statistical significance was determined by unpaired t test. **P ≤ 0.01. (B) RNA was extracted from the HTLV-1.mEnhancer clone for cDNA synthesis and qPCR to detect tax and hbz mRNA expression. Statistical significance was determined by two-way ANOVA. **P ≤ 0.01. (C) Total protein in cell lysates from parental 729.B cells, 729 HTLV-1.wt, and 729 HTLV-1.mEnhancer producer cells was quantified, and equal amounts were loaded onto an SDS-PAGE gel for immunoblotting analysis. β-actin is shown as a loading control, and arrows differentiate background from bands that represent Tax and Hbz protein. Graphs represent data generated from duplicate samples and error bars represent standard deviation (SD).
Figure 3
Figure 3
HTLV-1 enhancer element is dispensable for early in vivo viral persistence. Lethally irradiated 729 HTLV-1.wt or 729 HTLV-1.mEnhancer producer cells were inoculated into 14-week-old, male New Zealand white rabbits via the lateral ear vein. Blood was collected at Week 0 (pre-inoculation) and Weeks 4, 8, 12, 16, 20, and 25 post-infection (study endpoint) for plasma and rabbit PBMC (rPBMC) isolation. (A) Genomic DNA was isolated from rPBMCs and subjected to qPCR to detect proviral load using a primer and probe set specific to HTLV-1 Gag/pol. (B) Plasma was isolated from whole blood to measure the HTLV-specific antibody response using the Avioq HTLV-I/II Microelisa System. Absorbance was measured at 450 nm. In each of the graphs, unique symbols represent proviral load and antibody response for a single inoculated rabbit over time and bars represent the mean. Linear mixed-effects analyses were performed and multiple comparisons were adjusted by Tukey’s method.
Figure 4
Figure 4
HTLV-1 enhancer element alters in vivo sense and anti-sense viral gene expression. RNA was isolated from rPBMCs for cDNA synthesis. cDNA from rabbit samples and negative controls was used in 12-cycle pre-amplification reactions. Pre-amplification products were diluted according to the manufacturer’s directions for qPCR to detect viral gene expression. Copy numbers of Gag/pol (A) and Hbz (C) are shown relative to 1 x 10⁶ rgapdh copies. The levels of viral transcripts were evaluated by normalizing Gag/pol (B) or Hbz (D) copies per 106 rgapdh to proviral load. In each of the graphs, unique symbols represent gene expression for a single inoculated rabbit over time and bars represent the mean. Linear mixed-effects analyses were performed and multiple comparisons were adjusted by Tukey’s method. *P ≤ 0.05.
Figure 5
Figure 5
Loss of enhancer element has no effect on disease progression in HIS mice. Sub-lethally irradiated neonatal NSG received liver injections of 3 x 10⁴ to 1 x 10⁵ of CD34+ HUSC. 10 weeks after HUSC engraftment, mice were inoculated intraperitoneally with 1 x 10⁷ lethally irradiated 729 HTLV-1.wt or 729 HTLV-1.mEnhancer producer cells. (A) HTLV-1 infection induces lymphoproliferative disease in the mice, and survival rate was determined for animals inoculated with wt compared to mEnhancer virus. Mice were euthanized according to early removal criteria defined in the approved animal protocol. Statistical significance was determined by Log-rank (Mantel-Cox) test. (B) Genomic DNA was extracted from PBMCs isolated from mouse spleens and used for qPCR to detect proviral load using primers targeting HTLV-1 Gag/pol. Statistical significance was determined by Welch’s unpaired t test. (C) RNA extracted from hPBMCs was subjected to cDNA synthesis followed by qPCR to detect viral gene expression. Data are shown normalized to 1 x 10⁶ hgapdh copies. (D) The levels of viral transcripts were evaluated by normalizing Tax or Hbz copies per 106 hgapdh to proviral load. Unique symbols in (B–D) represent proviral load, gene expression, and viral transcripts per proviral copy number, respectively, in a single inoculated mouse and bars represent the mean. Statistical significance was determined by unpaired t-test.
Figure 6
Figure 6
HTLV-1.mEnhancer virus immortalizes primary human T-cells in vitro. Freshly isolated human PBMCs (2 x 10⁶; hPBMCs) from two healthy donors were co-cultured independently with 1 x 10⁶ lethally irradiated 729 HTLV-1.wt or HTLV-1.mEnhancer producer cells in 24-well plates for long-term immortalization assay. Cells were supplied with 10 U/mL hIL-2 once per week with media changes. T-cell immortalization in the co-culture with PBMCs from Donor 1 (A) and Donor 2 (B) was determined by weekly viable cell counts by trypan blue exclusion. Cell supernatant was collected at weekly intervals, beginning at Week 4, to measure virion production by p19 Gag ELISA. Samples from Donor 1 are represented by circles, and samples from Donor 2 are represented by squares. Each time point depicts data collected from three random, independent wells (technical replicates), and error bars represent SD. Wells with a p19 Gag value of zero are not shown in the graph due to log transformation. Statistical significance was determined by unpaired t test and two-way ANOVA with Sidak’s multiple comparisons test, where appropriate. *P ≤ 0.05, ** P ≤ 0.01, ****P ≤ 0.0001.
Figure 7
Figure 7
Loss of HTLV-1 enhancer element alters immortalization phenotype and viral gene expression in vitro. Newly immortalized PBL cell lines from two separate co-culture experiments with different PBMC donors were characterized in vitro. Cell lines from Donor 1 are represented by circles, and cell lines from Donor 2 are represented by squares. (A) T-cell phenotypic analysis of HTLV-1.wt (Donor 1 n=11; Donor 2 n=4) or HTLV-1.mEnhancer PBLs (Donor 1 n=5; Donor 2 n=9) was performed by flow cytometry. (B) Genomic DNA was extracted from PBL cell lines and used for qPCR to detect proviral load using primers targeting HTLV-1 Gag/pol (HTLV-1.wt: Donor 1 n=11, Donor 2 n=4; HTLV-1.mEnhancer: Donor 1 n=5, Donor 2 n=3). (C) Approximately 5 x 10⁵ PBLs were plated in 1 mL media. Supernatant was collected from each well after 72h and analyzed by p19 Gag ELISA. (HTLV-1.wt: Donor 1 n=6, Donor 2 n=2; HTLV-1.mEnhancer: Donor 1 n=5, Donor 2 n=3) (D) RNA was extracted from each PBL cell line, and subjected to cDNA synthesis followed by qPCR to detect tax and hbz gene expression. Data are shown normalized to 1 x 10⁶ hgapdh copies (HTLV-1.wt: Donor 1 n=11, Donor 2 n=4; HTLV-1.mEnhancer: Donor 1 n=5, Donor 2 n=6) (E, F) PBL RNA was isolated and used for cDNA synthesis. Pre-amplification was performed, followed by qPCR to determine expression of env, p12, p30, and p13 viral transcripts. Data are shown normalized to 1 x 10⁶ hgapdh copies. Values of zero for cell lines with undetectable transcripts are not plotted or included in the statistical analyses (HTLV-1.wt: Donor 1 n=6, Donor 2 n=4; HTLV-1.mEnhancer: Donor 1 n=5, Donor 2 n=6). Donor 1 and Donor 2 are abbreviated as D1 and D2, respectively, in (E). Statistical significance was determined by unpaired t test. **P ≤ 0.01, ***P ≤ 0.001, ****P ≤ 0.0001.
Figure 8
Figure 8
Loss of the HTLV-1 enhancer element leads to reduced proliferation and altered cell cycle progression of infected cells in vitro. (A) Proliferation of newly immortalized PBL lines was measured by MTS assay. Cell lines from Donor 1 are represented by circles, and cell lines from Donor 2 are represented by squares (HTLV-1.wt: Donor 1 n=3, Donor 2 n=3; HTLV-1.mEnhancer: Donor 1 n=2, Donor 2 n=3). Error bars represent the SD of 3 technical replicates. (B) PBL cell lines (HTLV-1.wt: Donor 1 n=3, Donor 2 n=3; HTLV-1.mEnhancer: Donor 1 n=3, Donor 2 n=2) were fixed and stained with propidium iodide, and cell cycle progression was measured by flow cytometry. Bars represent the mean with SD. (C) Cellular apoptosis was measured in PBL cell lines (HTLV-1.wt: Donor 1 n=6, Donor 2 n=4; HTLV-1.mEnhancer: Donor 1 n=4, Donor 2 n=6) using a FITC Annexin V Apoptosis Detection Kit. Bars represent the mean. Statistical significance was determined by unpaired t test. *P ≤ 0.05, **P ≤ 0.01, ****P ≤ 0.0001.

Similar articles

Cited by

References

    1. Gessain A, Cassar O. Epidemiological aspects and world distribution of HTLV-1 infection. Front Microbiol (2012) 3:388. doi: 10.3389/fmicb.2012.00388 - DOI - PMC - PubMed
    1. Poiesz BJ, Ruscetti FW, Gazdar AF, Bunn PA, Minna JD, Gallo RC. Detection and isolation of type c retrovirus particles from fresh and cultured lymphocytes of a patient with cutaneous T-cell lymphoma. Proc Natl Acad Sci U S A (1980) 77(12):7415–9. doi: 10.1073/pnas.77.12.7415 - DOI - PMC - PubMed
    1. Yoshida M, Miyoshi I, Hinuma Y. Isolation and characterization of retrovirus from cell lines of human adult T-cell leukemia and its implication in the disease. Proc Natl Acad Sci U S A (1982) 79(6):2031–5. doi: 10.1073/pnas.79.6.2031 - DOI - PMC - PubMed
    1. Uchiyama T, Yodoi J, Sagawa K, Takatsuki K, Uchino H. Adult T-cell leukemia: clinical and hematologic features of 16 cases. Blood (1977) 50(3):481–92. doi: 10.1182/blood.V50.3.481.481 - DOI - PubMed
    1. Osame M, Usuku K, Izumo S, Ijichi N, Amitani H, Igata A, et al. . HTLV-I associated myelopathy, a new clinical entity. Lancet (1986) 1(8488):1031–2. doi: 10.1016/S0140-6736(86)91298-5 - DOI - PubMed

Publication types