. 2022 Jul 8:13:906338.
doi: 10.3389/fimmu.2022.906338. eCollection 2022.

Dynamics of Host Immune Response Development During Schistosoma mansoni Infection

Affiliations

Dynamics of Host Immune Response Development During Schistosoma mansoni Infection

Alice H Costain et al. Front Immunol. .

Erratum in

Abstract

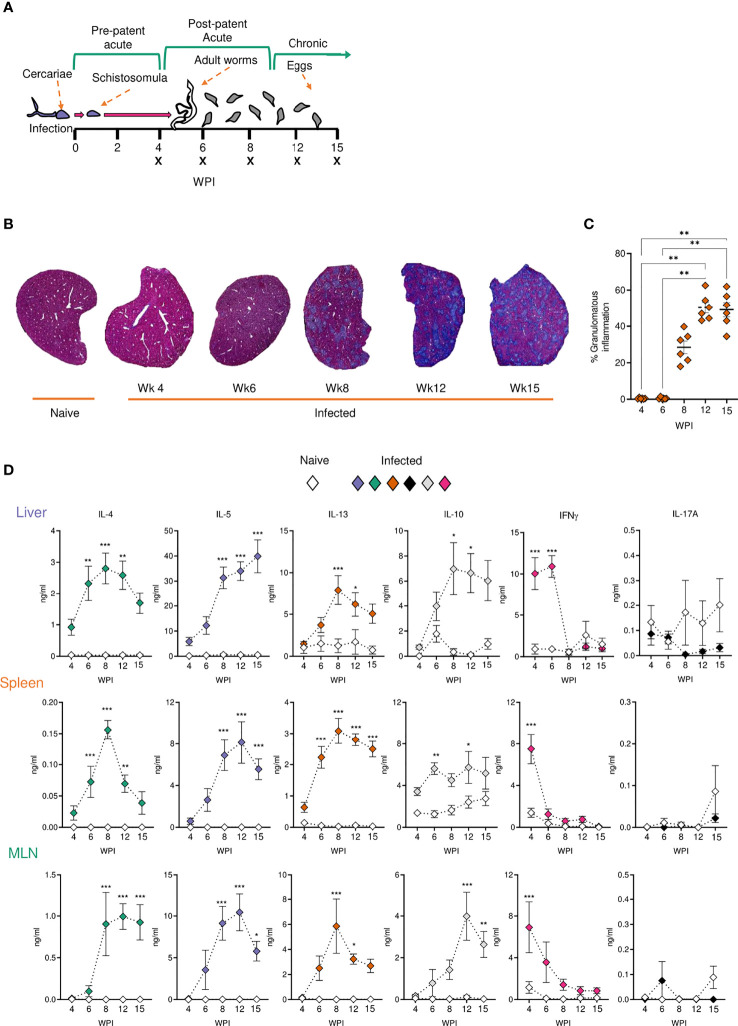
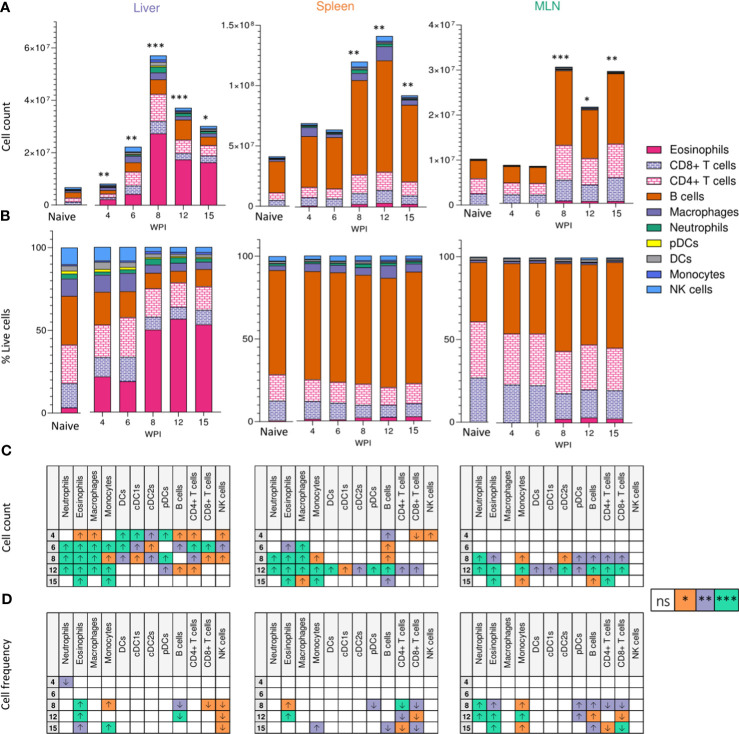
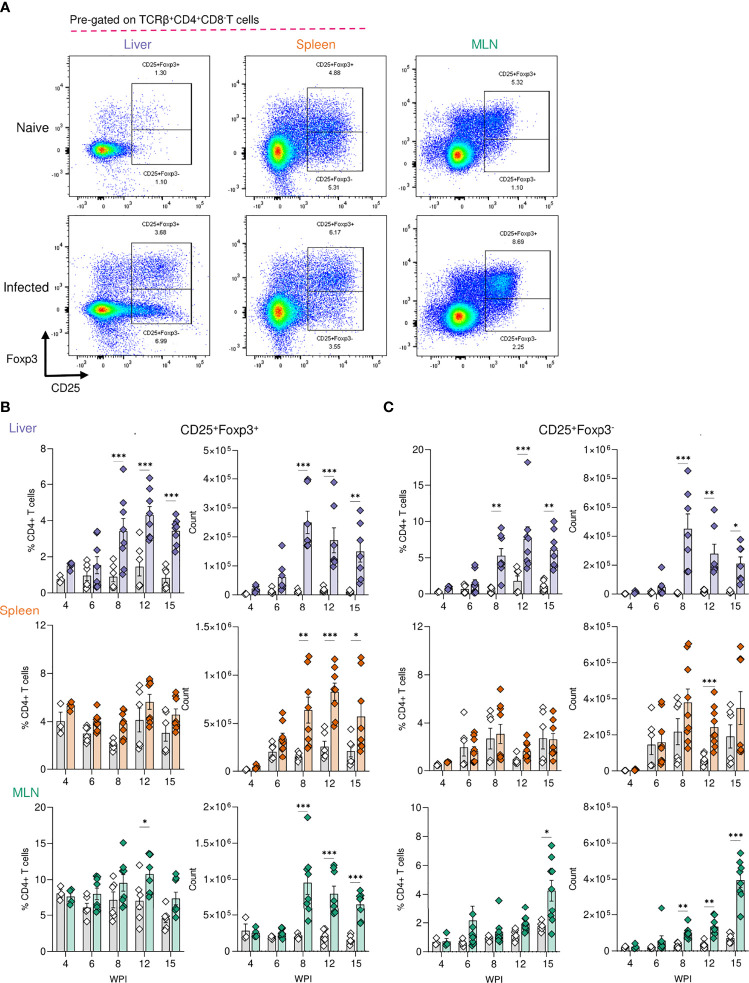
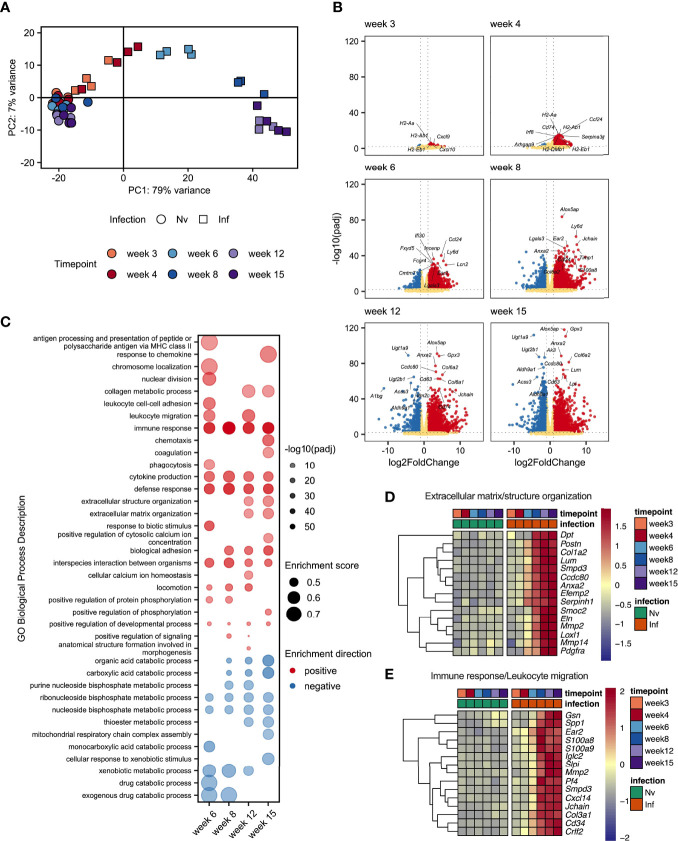
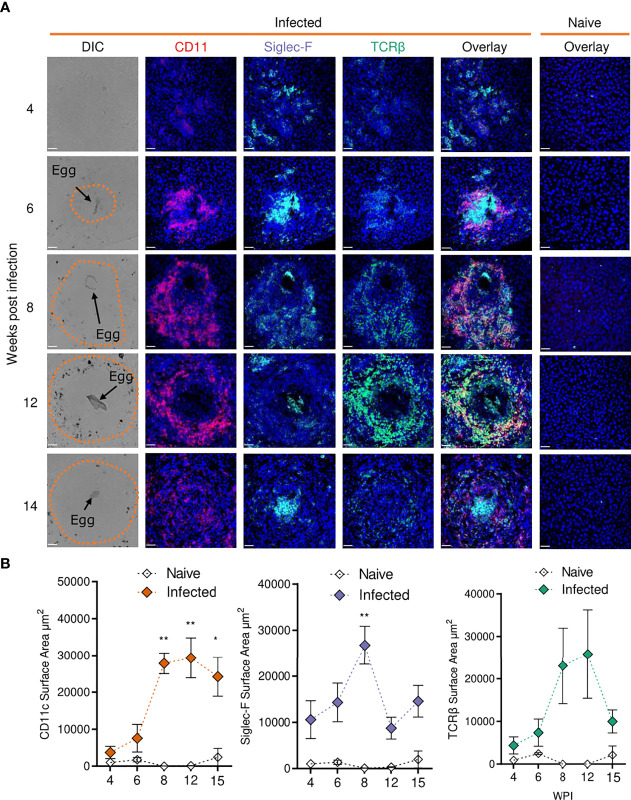
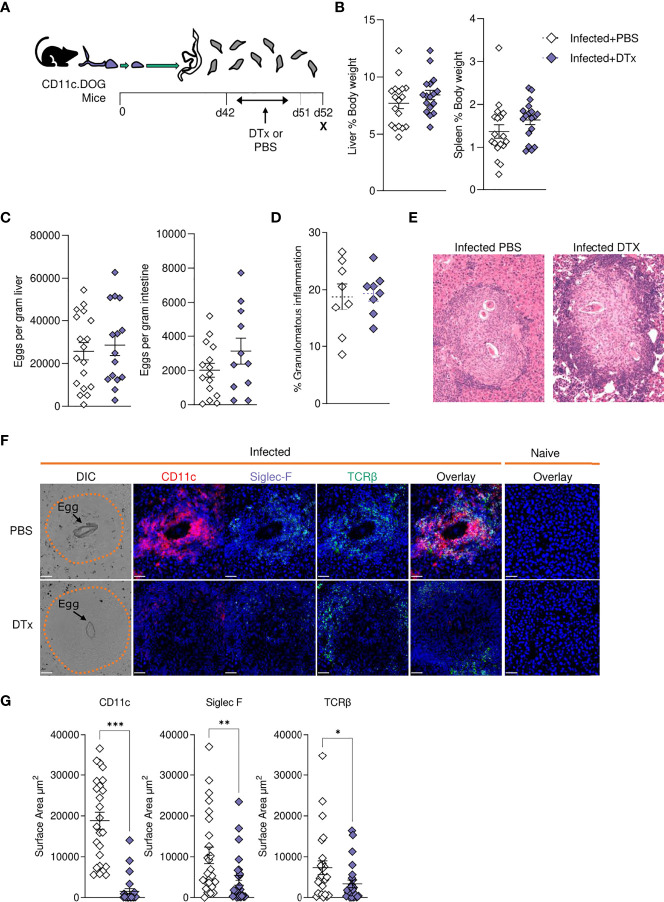
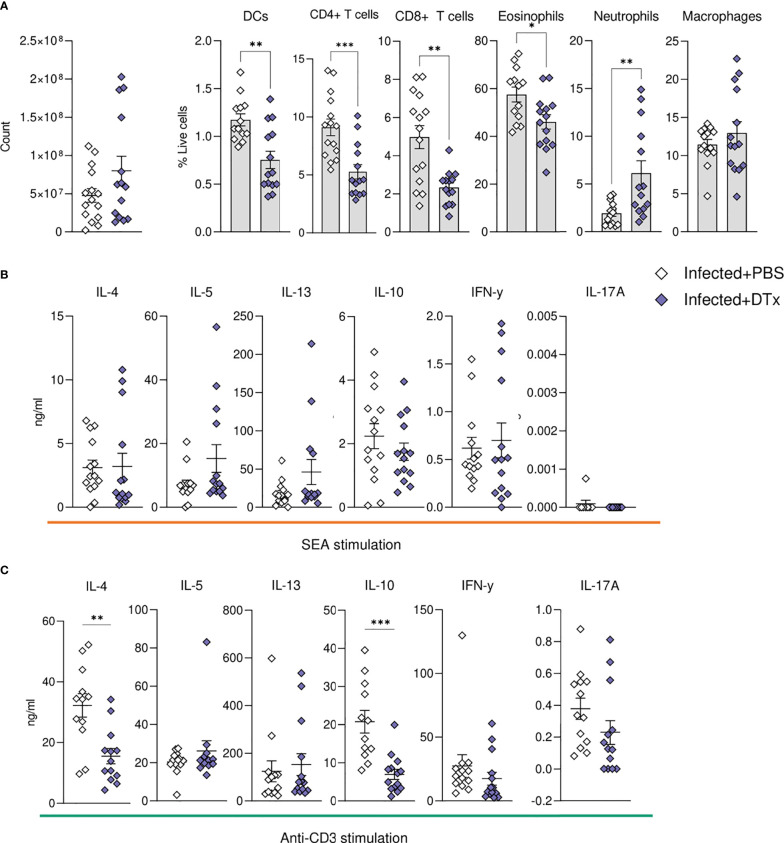
Schistosomiasis is a disease of global significance, with severity and pathology directly related to how the host responds to infection. The immunological narrative of schistosomiasis has been constructed through decades of study, with researchers often focussing on isolated time points, cell types and tissue sites of interest. However, the field currently lacks a comprehensive and up-to-date understanding of the immune trajectory of schistosomiasis over infection and across multiple tissue sites. We have defined schistosome-elicited immune responses at several distinct stages of the parasite lifecycle, in three tissue sites affected by infection: the liver, spleen, and mesenteric lymph nodes. Additionally, by performing RNA-seq on the livers of schistosome infected mice, we have generated novel transcriptomic insight into the development of schistosome-associated liver pathology and fibrosis across the breadth of infection. Through depletion of CD11c+ cells during peak stages of schistosome-driven inflammation, we have revealed a critical role for CD11c+ cells in the co-ordination and regulation of Th2 inflammation during infection. Our data provide an updated and high-resolution account of how host immune responses evolve over the course of murine schistosomiasis, underscoring the significance of CD11c+ cells in dictating host immunopathology against this important helminth infection.

Keywords: chronic infection; dendritic cells; pathology; schistosomiasis; transcriptomic (RNA-seq).


Conflict of interest statement

Author RL was employed by company 360biolabs. The remaining authors declare that the research was conducted in the absence of any commercial or financial relationships that could be construed as a potential conflict of interest.

Figures

Figure 1
Figure 1
Development of granulomatous pathology and a dominant Type 2 response during S. mansoni infection. (A) Schematic of infection setup. C57BL/6 mice were infected with 40 S. mansoni cercariae with infections lasting, 4, 6, 8, 12 or 15 wks in duration (indicated by X). (B) Representative images of liver sections stained with Masson’s Trichrome (MT) at indicated wks, allowing for visualisation of inflammatory cell infiltration and type I collagen deposition. (C) The proportion of granulomatous inflammation per tissue section, using an objective algorithm to quantify the number of pixels of granulomatous inflammation in a defined region of interest. (D) At specified wks, liver, spleen and MLN cells from naïve and schistosome infected mice were cultured for 72 h with 0.25 µg of schistosome egg antigen (SEA; antigen-specific stimulation). Supernatants were collected and cytokine production (medium alone values subtracted) was assessed by ELISA. Data are from a single experiment (B, C) or pooled from 2 (D) separate experiments (n=36-10 animals per time point). Significance calculated by one-way (C) or two-way ANOVA (D). Data presented as mean +/- SEM. *p < 0.05, **p < 0.01, ***p < 0.001.
Figure 2
Figure 2
Tissue-specific cellular responses during schistosomiasis. Stacked bar charts showing hepatic splenic and mesenteric (A) cell counts and (B) cell frequencies (as a proportion of total live cells) at indicated wks of infection when infected with 40 cercariae. For infected mice, data is presented as mean values for each given time point, with averages calculated from two pooled experiments per time point. n=6-8 per timepoint from two pooled experiments. Naïve data is presented as mean values for the entire infection, with averages calculated from two pooled time course experiments. n=30. Significance in (A) reflects comparison of total cell counts between naïve and infected mice. Statistics tables showing differences in (C) cell counts and (D) cell frequencies between naïve and infected mice, for the liver spleen and MLN. Arrows in table (C, D) represent the direction of cell frequency change in infected animals in comparison to naïve. Significance calculated by Kruskal-Wallis followed by Dunn’s multiple comparisons test, with comparison between naïve and infected groups. *p < 0.05, **p < 0.01, ***p < 0.001, ns = non-significant (P > 0.05).
Figure 3
Figure 3
Regulatory T cell dynamics across S. mansoni infected tissues. (A) Representative flow plots for CD25+Foxp3+ and CD25+Foxp3- gating, pre-gating on live CD45+TCRβ+CD4+CD8- cells. The frequency and total numbers of (B) CD25+Foxp3+ T cells and (C) CD25+Foxp3- cells in the liver, spleen and MLN of naïve and 40 cercariae infected mice, at indicated timepoints, and with frequency presented as % of total CD4+ T cells. (B, C). Results are mean +/- SEM from two experiments pooled (wks 6-15) or a single experiment (wk4) (n=3-8 mice per group per time-point). Significance calculated by two-way ANOVA. *p < 0.05, **p < 0.01, ***p < 0.001.
Figure 4
Figure 4
Schistosome egg deposition dramatically alters the liver transcriptome. Livers from schistosome infected mice (Inf) or matched naïve controls (Nv) were harvested at 3, 4, 6, 8, 12 and 15 wks post infection (40 cercariae infection, n=3-4 per timepoint). RNA was isolated from the liver tissue and transcriptionally profiled by RNAseq. (A) Principal components analysis of total read counts. Points represent individual replicates. Point shape indicates group, Nv (○) Inf (◻), and colour indicates timepoint. (B) Volcano plots of differentially expressed protein-coding genes in Inf vs Nv mice at each time point. Genes were considered significantly differentially expressed in Inf mice when the adjusted p value (padj) was < 0.01 and the log2FoldChange was > 1. Red dots indicate genes significantly up-regulated in Inf mice, blue dots indicate genes significantly down-regulated in Inf mice, yellow dots represent genes not significantly differentially expressed between Inf and Nv mice. (C) Gene set enrichment (GSE) analysis for Inf mice from wk 6 to wk 12 using GO Biological Process terms based on genes with a padj < 0.01 vs Nv mice. Points represent the enrichment score for a given GO term at each time point. Size of point indicates the enrichment score. Opacity of point indicates the significance value for that enrichment score expressed as -log10(padj). Point colour indicates whether a given GO term was positively (red) or negatively (blue) enriched. Blank spaces indicate that GO term was not significantly enriched at that timepoint. GO terms were considered significantly enriched if padj < 0.01. Heatmaps representing the mean expression of top 15 most significantly differentially expressed genes identified in specific GO terms: (D) “extracellular matrix structure” and “extracellular matrix organisation” and (E) “Immune response”, and “Leukocyte migration”. All genes presented by heatmap had a p value < 0.01. Differential expression analysis was performed using DESeq2, GSE analysis was performed using clusterProfiler.
Figure 5
Figure 5
Confocal microscopy analysis reveals distinct alterations in hepatic granuloma composition across infection timeline. At indicated stages of 40 cercarial dose infection, the infiltration and localization of CD11c+, Siglec-F+ and TCRβ+ cells in hepatic granulomas was assessed by IHC. (A) Representative confocal microscopy images taken from livers of 5 S. mansoni infected mice at each timepoint. Top row showing differential Interference Contrast (DIC) images, with eggs indicated by arrows and dotted lines outlining granuloma periphery. (B) Quantification by Image J of positive Siglec-F, CD11c and TCRβ staining. 1 experiment. Significance calculated by Two-way ANOVA. Data presented as mean +/- SEM. *p < 0.05, **p < 0.01. Bars indicate SEM of from 3 sections of naïve hepatic tissue vs 10 granulomas from infected mice.
Figure 6
Figure 6
CD11c depletion disrupts granulomatous pathology during S. mansoni infection. (A) Schematic of infection setup. CD11c.DOG mice were infected with 40 S. mansoni cercariae with CD11c+ cells depleted via Dtx administration on days 42-51, and mice culled at d52. (B) Liver and spleen weights for infected mice with data represented as a proportion of total body weight. (C) The total number of schistosome eggs per gram of liver or intestinal tissue. (D) Quantification of granulomatous inflammation. (E) Representative images of hepatic granulomas stained with H&E. (F) Representative confocal microscopy granuloma images, with staining for CD11c, Siglec-F and TCRβ. First column showing differential Interference Contrast (DIC) images, with eggs indicated by arrows and dotted lines outlining granuloma periphery. (G) Quantification of positive Siglec-F, CD11C and TCRβ staining. Data are from a single experiment (D–G) or pooled from 3 (A–C) 3 separate experiments. Significance calculated by unpaired T-test. Data presented as mean +/- SEM. *p < 0.05, **p < 0.01, ***p < 0.001.
Figure 7
Figure 7
CD11c depletion compromises hepatic cellular dynamics during S. mansoni infection. CD11c.DOG mice were infected with 40 S. mansoni cercariae, with CD11c+ cells depleted on d42-51 via Dtx administration, and mice culled on d52. The total number of liver cells (A) and the frequency of various immune cells in the liver of Dtx of PBS treated infected mice. Liver cells were cultured for 72 h with (B) 0.25 µg of SEA or (C) 0.5μg of anti-CD3. Supernatants were collected and cytokine production (medium alone values subtracted) was assessed by ELISA. Data are pooled from 3 separate experiments (n=12-18 animals per time point). Significance calculated by unpaired T-test. Data presented as mean +/- SEM. *p < 0.05, **p < 0.01, ***p < 0.001.

Similar articles

Cited by

References

    1. McManus DP, Dunne DW, Sacko M, Utzinger J, Vennervald BJ, Zhou XN, et al. . Schistosomiasis. Nat Rev Dis Primers (2018) 4:1–19. doi: 10.1038/s41572-018-0013-8 - DOI - PubMed
    1. Pearce EJ, MacDonald AS. The Immunobiology of Schistosomiasis. Nat Rev Immunol (2002) 2:499–511. doi: 10.1038/nri843 - DOI - PubMed
    1. Houlder EL, Costain AH, Cook PC, MacDonald AS. Schistosomes in the Lung: Immunobiology and Opportunity. Front Immunol (2021) 0:1330. doi: 10.3389/fimmu.2021.635513 - DOI - PMC - PubMed
    1. Costain AH, MacDonald AS, Smits HH. Schistosome Egg Migration: Mechanisms, Pathogenesis and Host Immune Responses. Front Immunol (2018) 9:3042. doi: 10.3389/fimmu.2018.03042 - DOI - PMC - PubMed
    1. Taylor JJ, Krawczyk CM, Mohrs M, Pearce EJ. Th2 Cell Hyporesponsiveness During Chronic Murine Schistosomiasis is Cell Intrinsic and Linked to GRAIL Expression. J Clin Invest (2009) 119:1019–28. doi: 10.1172/JCI36534 - DOI - PMC - PubMed

Publication types