

Identification and validation of an immune signature associated with EMT and metabolic reprogramming for predicting prognosis and drug response in bladder cancer
- PMID: 35958586
- PMCID: PMC9359097
- DOI: 10.3389/fimmu.2022.954616
Identification and validation of an immune signature associated with EMT and metabolic reprogramming for predicting prognosis and drug response in bladder cancer
Abstract
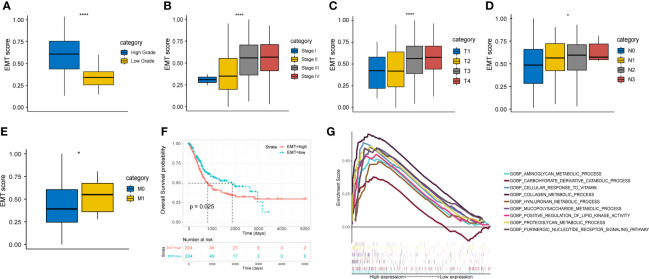
Background: Epithelial-mesenchymal transition (EMT), one leading reason of the dismal prognosis of bladder cancer (BLCA), is closely associated with tumor invasion and metastasis. We aimed to develop a novel immune-related gene signature based on different EMT and metabolic status to predict the prognosis of BLCA.
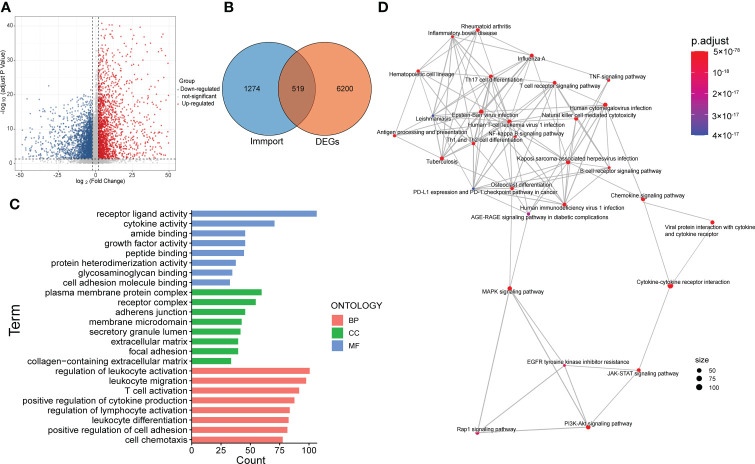
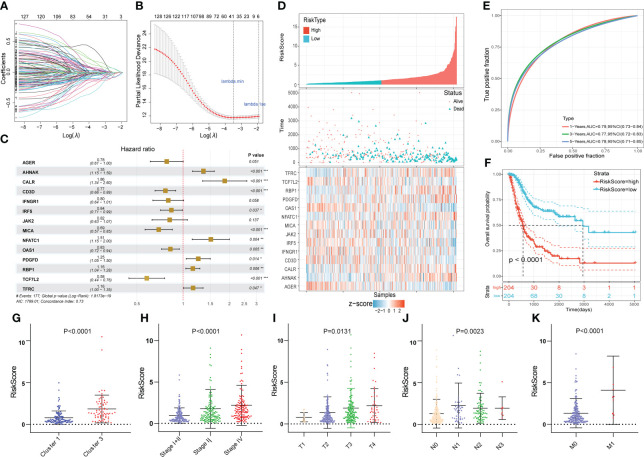
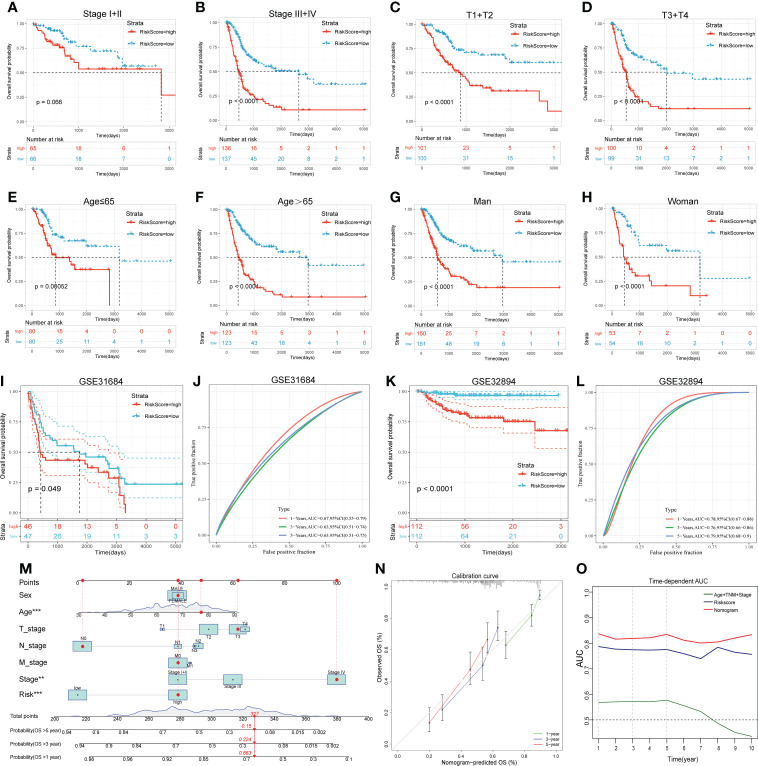
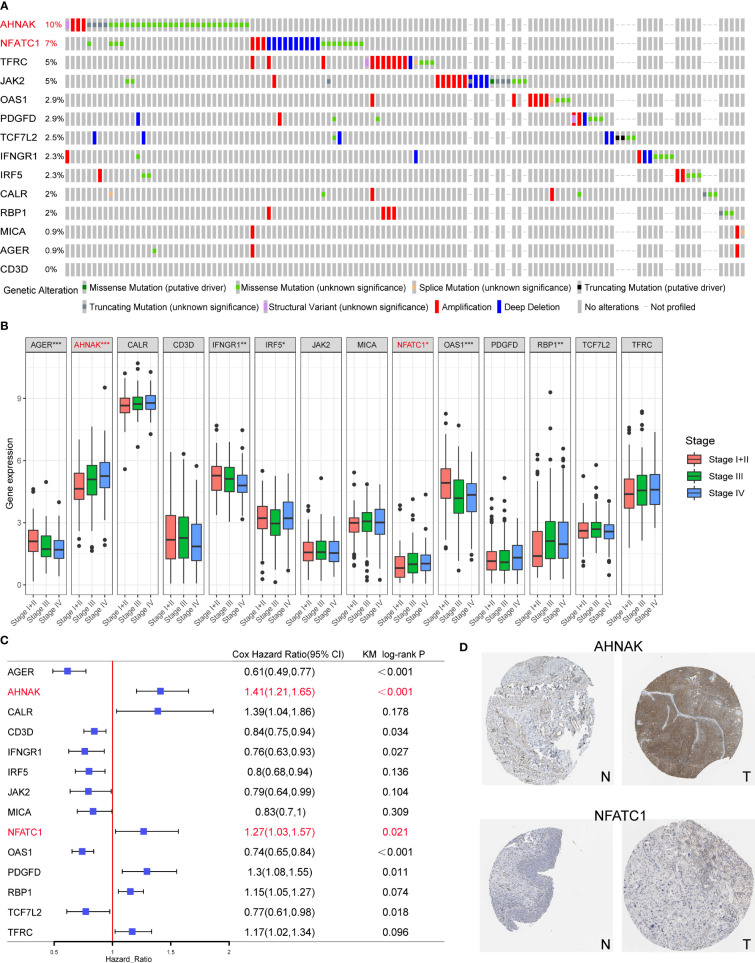
Methods: Gene expression and clinical data were obtained from TCGA and GEO databases. Patients were clustered based on EMT and metabolism scores calculated by ssGSEA. The immune-related differentially expressed genes (DEGs) between the two clusters with the most obvious differences were used to construct the signature by LASSO and Cox analysis. Time-dependent receiver operating characteristic (ROC) curves and Kaplan-Meier curves were utilized to evaluate the gene signature in training and validation cohorts. Finally, the function of the signature genes AHNAK and NFATC1 in BLCA cell lines were explored by cytological experiments.
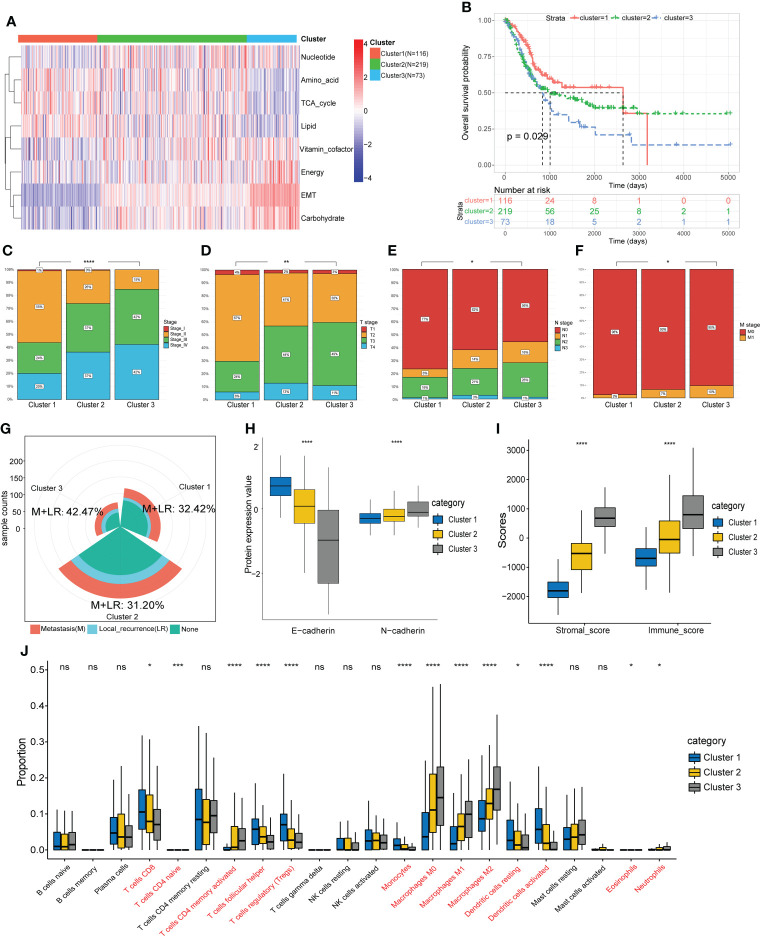
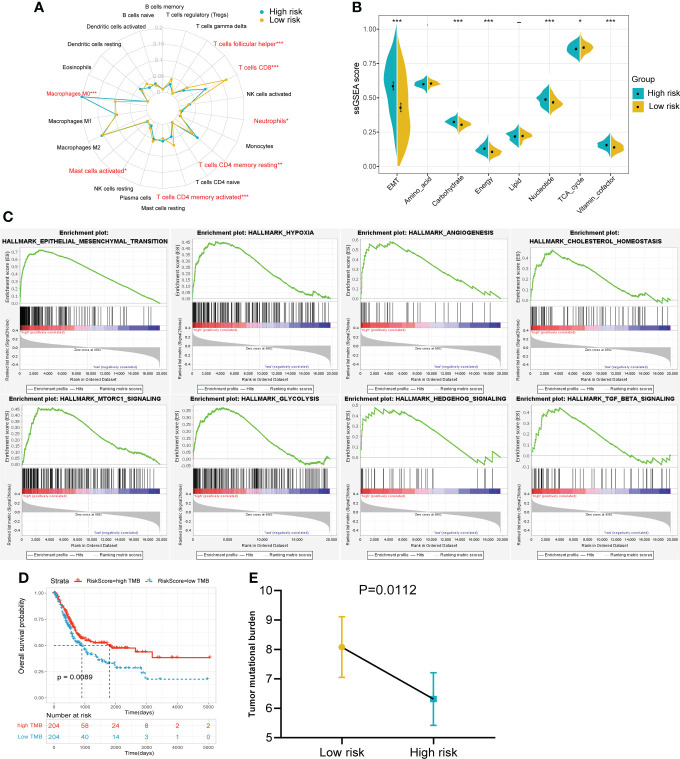
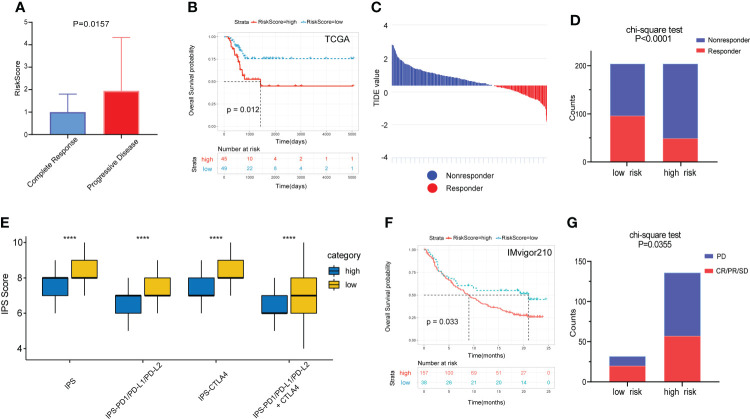
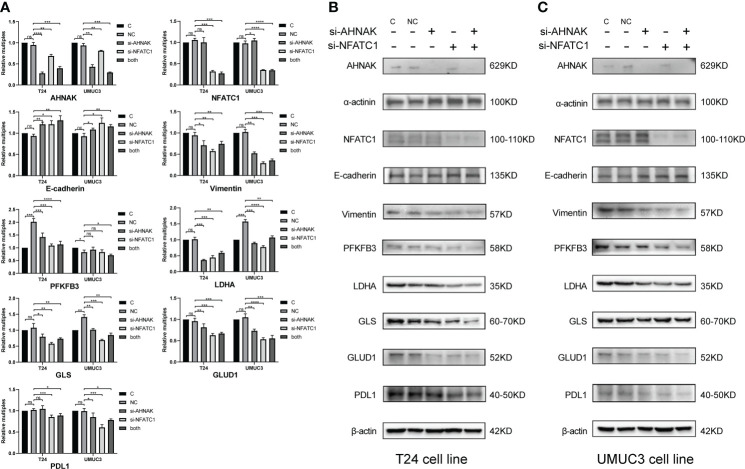
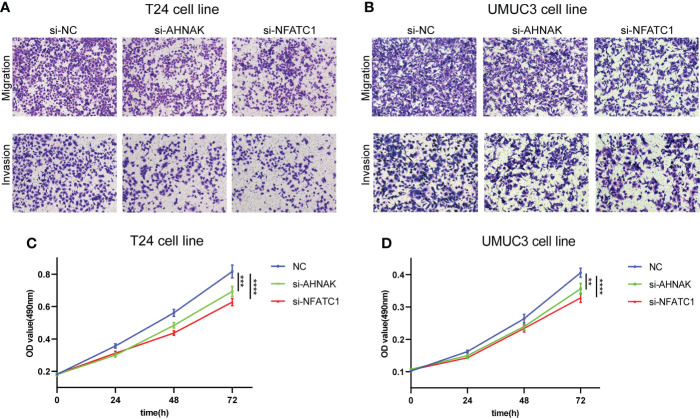
Results: Based on the results of ssGSEA, TCGA patients were divided into three clusters, among which cluster 1 and cluster 3 had completely opposite EMT and metabolic status. Patients in cluster 3 had a significantly worse clinical prognosis than cluster 1. Immune-related DEGs were selected between the two clusters to construct the predictive signature based on 14 genes. High-risk patients had poorer prognosis, lower proportions of CD8+ T cells, higher EMT and carbohydrate metabolism, and less sensitivity to chemotherapy and immunotherapy. Overexpression of AHNAK or NFATC1 promoted the proliferation, migration and invasion of T24 and UMUC3 cells. Silencing ANHAK or NFATC1 could effectively inhibit EMT and metabolism in T24 and UMUC3 cells.
Conclusion: The established immune signature may act as a promising model for generating accurate prognosis for patients and predicting their EMT and metabolic status, thus guiding the treatment of BLCA patients.
Keywords: bladder cancer; epithelial-mesenchymal transition; gene signature; metabolic reprogramming; prognosis.
Copyright © 2022 Zhang, Yu, Li, Wang, Jiao, Liang and Niu.
Conflict of interest statement
The authors declare that the research was conducted in the absence of any commercial or financial relationships that could be construed as a potential conflict of interest.
Figures
Similar articles
-
TEAD4 functions as a prognostic biomarker and triggers EMT via PI3K/AKT pathway in bladder cancer.J Exp Clin Cancer Res. 2022 May 17;41(1):175. doi: 10.1186/s13046-022-02377-3. J Exp Clin Cancer Res. 2022. PMID: 35581606 Free PMC article.
-
TFRC, associated with hypoxia and immune, is a prognostic factor and potential therapeutic target for bladder cancer.Eur J Med Res. 2024 Feb 9;29(1):112. doi: 10.1186/s40001-024-01688-9. Eur J Med Res. 2024. PMID: 38336764 Free PMC article.
-
Tumor stemness score to estimate epithelial-to-mesenchymal transition (EMT) and cancer stem cells (CSCs) characterization and to predict the prognosis and immunotherapy response in bladder urothelial carcinoma.Stem Cell Res Ther. 2023 Feb 1;14(1):15. doi: 10.1186/s13287-023-03239-1. Stem Cell Res Ther. 2023. PMID: 36721217 Free PMC article.
-
Therapeutic Benefits and Prognostic Value of a Model Based on 7 Immune-associated Genes in Bladder Cancer.Altern Ther Health Med. 2024 Apr;30(4):130-138. Altern Ther Health Med. 2024. PMID: 38518167
-
Wnt pathway-related three-mRNA clinical outcome signature in bladder urothelial carcinoma: computational biology and experimental analyses.J Transl Med. 2021 Sep 27;19(1):409. doi: 10.1186/s12967-021-03061-4. J Transl Med. 2021. PMID: 34579753 Free PMC article.
Cited by
-
Valosin-containing protein (VCP), a component of tumor-derived extracellular vesicles, impairs the barrier integrity of brain microvascular endothelial cells.BBA Adv. 2024 Dec 12;7:100130. doi: 10.1016/j.bbadva.2024.100130. eCollection 2025. BBA Adv. 2024. PMID: 39802400 Free PMC article.
-
SYNPO2 promotes the development of BLCA by upregulating the infiltration of resting mast cells and increasing the resistance to immunotherapy.Oncol Rep. 2024 Jan;51(1):14. doi: 10.3892/or.2023.8673. Epub 2023 Dec 1. Oncol Rep. 2024. PMID: 38038167 Free PMC article.
-
Exploring the correlation of glycolysis-related chondroitin polymerizing factor (CHPF) with clinical characteristics, immune infiltration, and cuproptosis in bladder cancer.Am J Cancer Res. 2023 Jun 15;13(6):2213-2233. eCollection 2023. Am J Cancer Res. 2023. PMID: 37424829 Free PMC article.
-
BLCA prognostic model creation and validation based on immune gene-metabolic gene combination.Discov Oncol. 2023 Dec 16;14(1):232. doi: 10.1007/s12672-023-00853-6. Discov Oncol. 2023. PMID: 38103068 Free PMC article.
-
Immune-related genes can accurately predict survival in bladder cancer: a retrospective study via two independent immunotherapy cohorts.Transl Androl Urol. 2025 Jun 30;14(6):1661-1678. doi: 10.21037/tau-2025-28. Epub 2025 Jun 26. Transl Androl Urol. 2025. PMID: 40687668 Free PMC article.
References
Publication types
MeSH terms
LinkOut - more resources
Full Text Sources
Medical
Research Materials
Miscellaneous