

Comprehensive FGFR3 alteration-related transcriptomic characterization is involved in immune infiltration and correlated with prognosis and immunotherapy response of bladder cancer
- PMID: 35958598
- PMCID: PMC9360490
- DOI: 10.3389/fimmu.2022.931906
Comprehensive FGFR3 alteration-related transcriptomic characterization is involved in immune infiltration and correlated with prognosis and immunotherapy response of bladder cancer
Abstract
Background: Bladder cancer (BC) threatens the health of human beings worldwide because of its high recurrence rate and mortality. As an actionable biomarker, fibroblast growth factor receptor 3 (FGFR3) alterations have been revealed as a vital biomarker and associated with favorable outcomes in BC. However, the comprehensive relationship between the FGFR3 alteration associated gene expression profile and the prognosis of BC remains ambiguous.
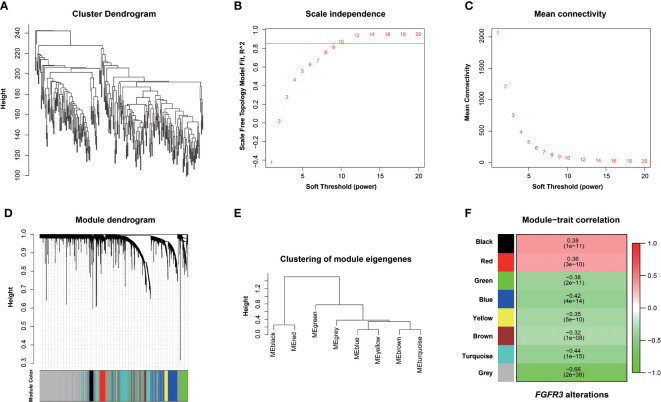
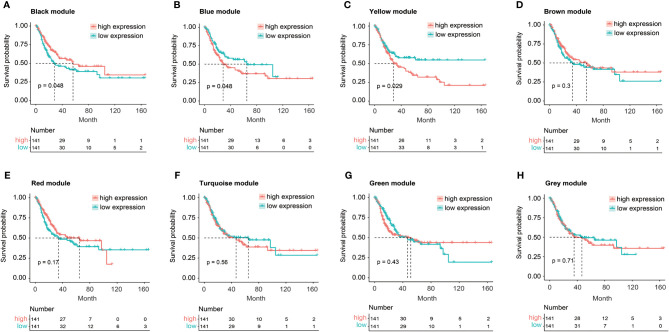
Materials and methods: Genomic alteration profile, gene expression data, and related clinical information of BC patients were downloaded from The Cancer Genomics database (TCGA), as a training cohort. Subsequently, the Weighted Gene Co-expression Network Analysis (WGCNA) was conducted to identify the hub modules correlated with FGFR3 alteration. The univariate, multivariate, and least absolute shrinkage and selection operator (LASSO) Cox regression analyses were used to obtain an FGFR3 alteration-related gene (FARG) prognostic signature and FARG-based nomogram. The receiver operating characteristic (ROC) curve analysis was used for evaluation of the ability of prognosis prediction. The FARG signature was validated in four independent datasets, namely, GSE13507, GSE31684, GSE32548, and GSE48075, from Gene Expression Omnibus (GEO). Then, clinical feature association analysis, functional enrichment, genomic alteration enrichment, and tumor environment analysis were conducted to reveal differential clinical and molecular characterizations in different risk groups. Lastly, the treatment response was evaluated in the immunotherapy-related dataset of the IMvigor210 cohort and the frontline chemotherapy dataset of GSE48276, and the chemo-drug sensitivity was estimated via Genomics of Drug Sensitivity in Cancer (GDSC).
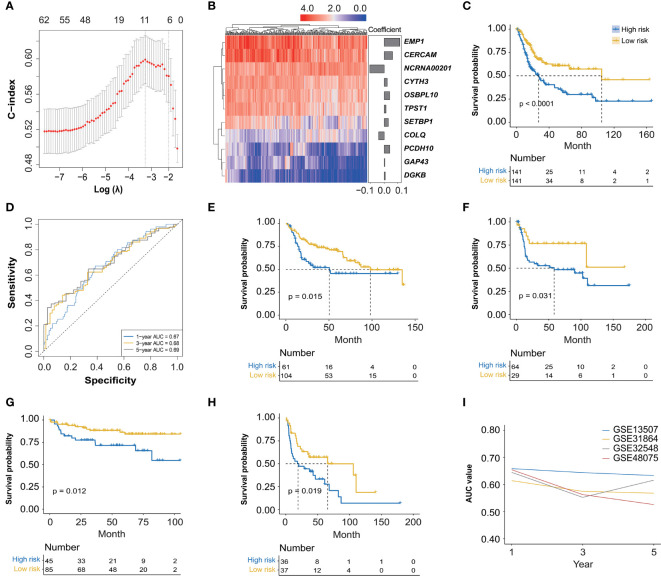
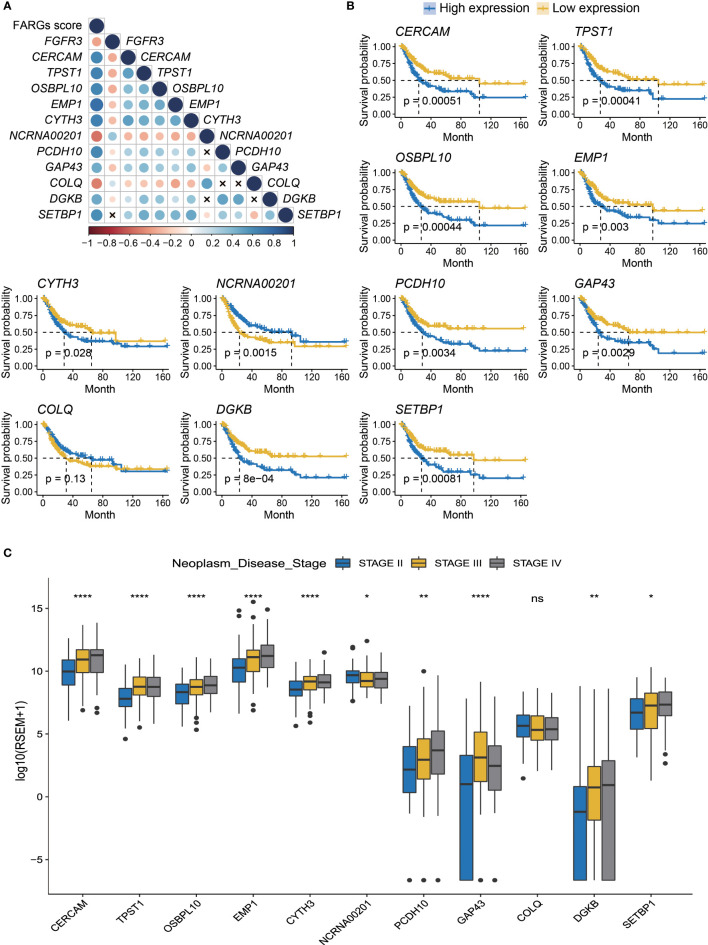
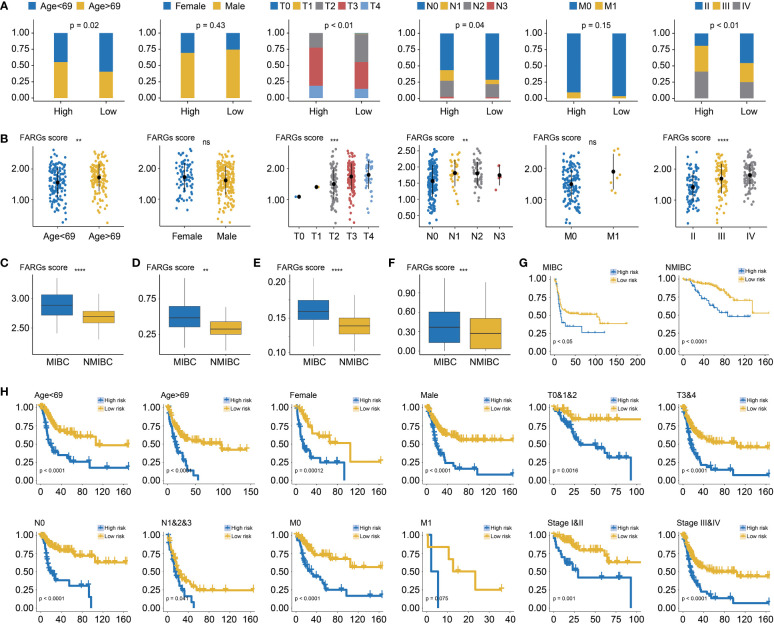
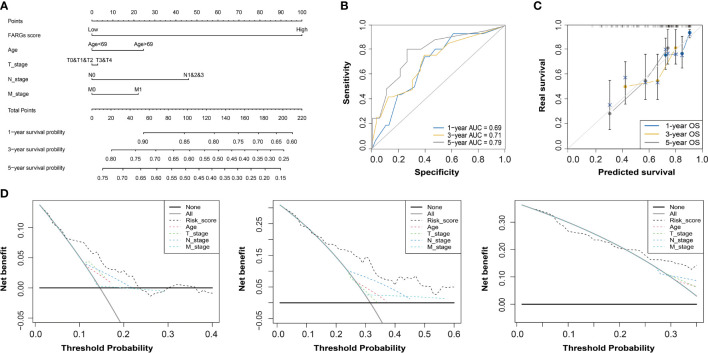
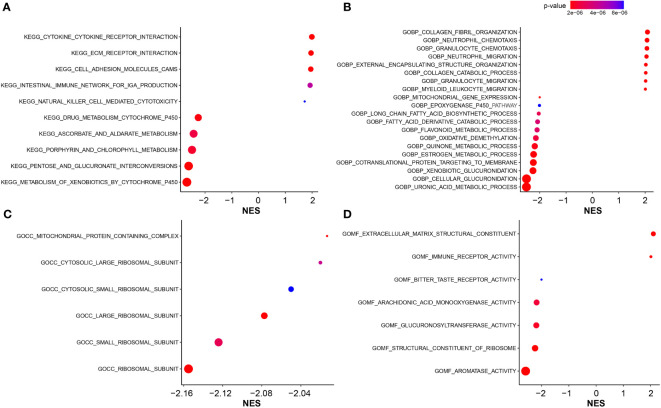
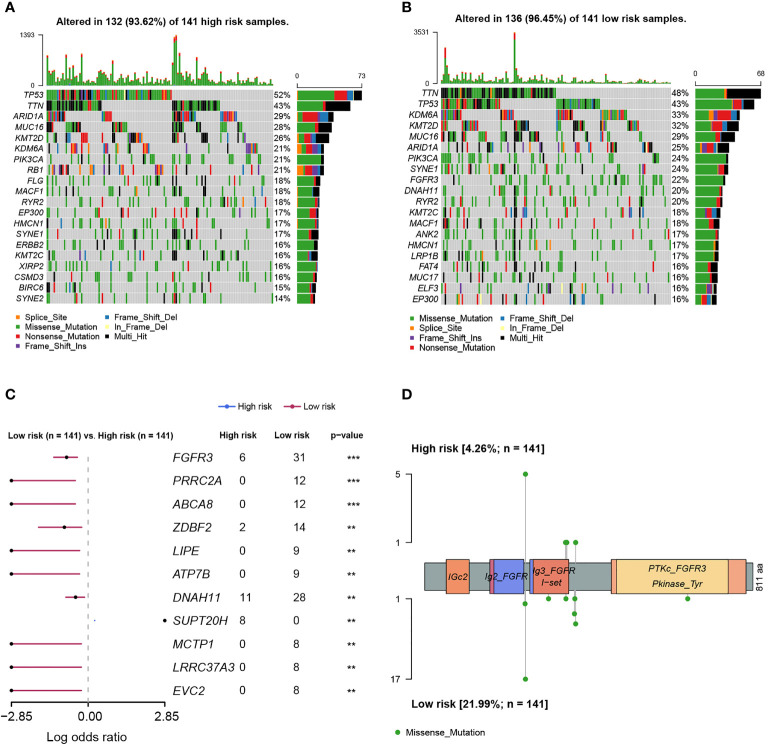
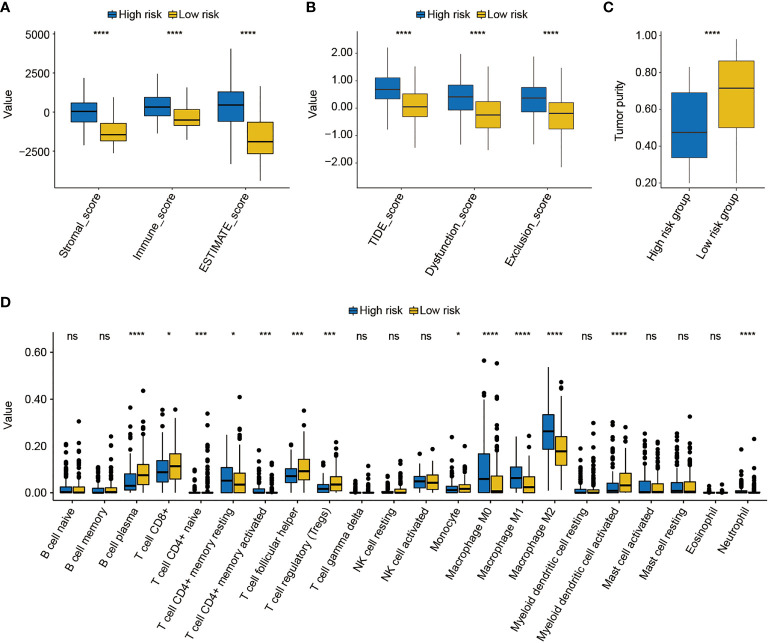
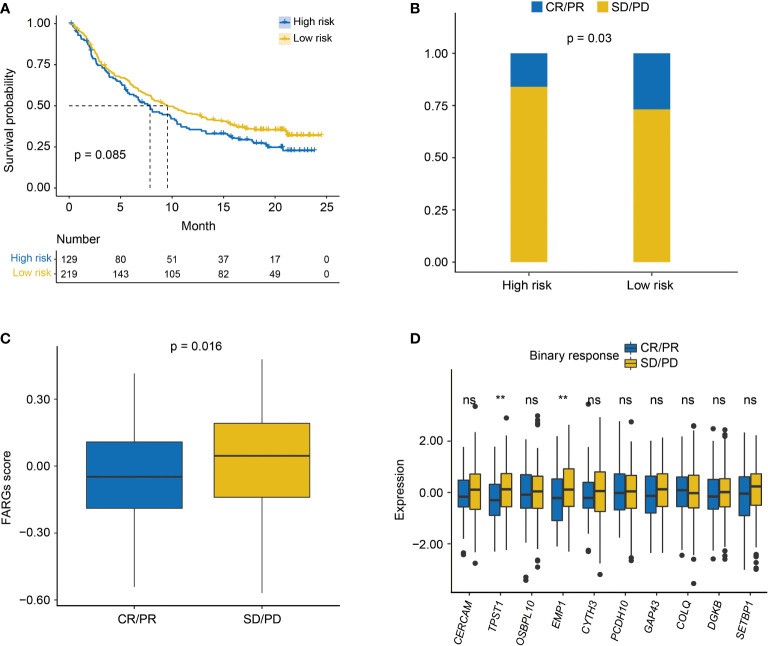
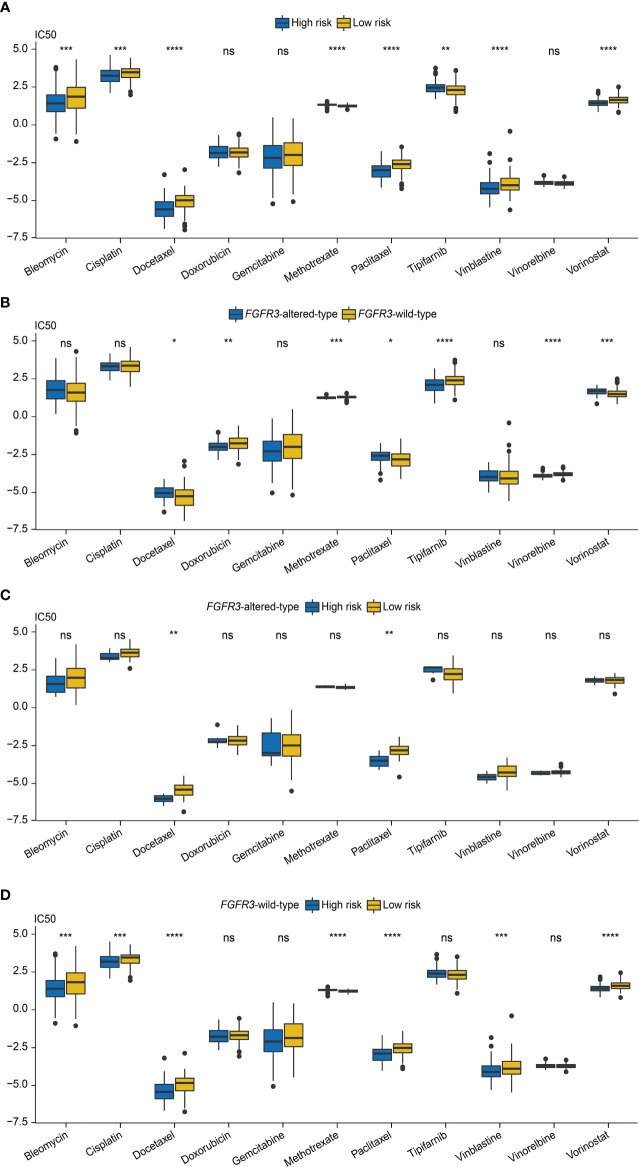
Results: There were a total of eleven genes (CERCAM, TPST1, OSBPL10, EMP1, CYTH3, NCRNA00201, PCDH10, GAP43, COLQ, DGKB, and SETBP1) identified in the FARG signature, which divided BC patients from the TCGA cohort into high- and low-risk groups. The Kaplan-Meier curve analysis demonstrated that BC patients in the low-risk group have superior overall survival (OS) than those in the high-risk group (median OS: 27.06 months vs. 104.65 months, p < 0.0001). Moreover, the FARG signature not only showed a good performance in prognosis prediction, but also could distinguish patients with different neoplasm disease stages, notably whether patients presented with muscle invasive phenotype. Compared to clinicopathological features, the FARG signature was found to be the only independent prognostic factor, and subsequently, a FARG-based prognostic nomogram was constructed with better ability of prognosis prediction, indicated by area under ROC curve (AUC) values for 1-, 3-, and 5-year OS of 0.69, 0.71, and 0.79, respectively. Underlying the FARG signature, multiple kinds of metabolism- and immune-related signaling pathways were enriched. Genomic alteration enrichment further identified that FGFR3 alterations, especially c.746C>G (p.Ser249Cys), were more prevalent in the low-risk group. Additionally, FARG score was positively correlated with ESTIMATE and TIDE scores, and the low-risk group had abundant enrichment of plasma B cells, CD8+ T cells, CD4+ naive T cells, and helper follicular T cells, implying that patients in the low-risk group were likely to make significant responses to immunotherapy, which was further supported by the analysis in the IMvigor210 cohort as there was a significantly higher response rate among patients with lower FARG scores. The analysis of the GDSC database finally demonstrated that low-risk samples were more sensitive to methotrexate and tipifarnib, whereas those in the high-risk group had higher sensitivities in cisplatin, docetaxel, and paclitaxel, instead.
Conclusion: The novel established FARG signature based on a comprehensive FGFR3 alteration-related transcriptomic profile performed well in prognosis prediction and was also correlated with immunotherapy and chemotherapy treatment responses, which had great potential in future clinical applications.
Keywords: FGFR3 alteration-related genes (FARGs); bladder cancer; chemotherapy response; fibroblast growth factor receptor 3; immune infiltration; immunotherapy response; nomogram; overall survival.
Copyright © 2022 Xu, Xu, Zheng, Li, Cai, Xu, Zou and Yu.
Conflict of interest statement
The authors declare that the research was conducted in the absence of any commercial or financial relationships that could be construed as a potential conflict of interest.
Figures
Similar articles
-
Integrative transcriptional characterization of cell cycle checkpoint genes promotes clinical management and precision medicine in bladder carcinoma.Front Oncol. 2022 Aug 11;12:915662. doi: 10.3389/fonc.2022.915662. eCollection 2022. Front Oncol. 2022. PMID: 36033441 Free PMC article.
-
Identification of a Nuclear Mitochondrial-Related Multi-Genes Signature to Predict the Prognosis of Bladder Cancer.Front Oncol. 2021 Oct 6;11:746029. doi: 10.3389/fonc.2021.746029. eCollection 2021. Front Oncol. 2021. PMID: 34692528 Free PMC article.
-
Mitochondrial-Related Transcriptome Feature Correlates with Prognosis, Vascular Invasion, Tumor Microenvironment, and Treatment Response in Hepatocellular Carcinoma.Oxid Med Cell Longev. 2022 Apr 30;2022:1592905. doi: 10.1155/2022/1592905. eCollection 2022. Oxid Med Cell Longev. 2022. PMID: 35535359 Free PMC article.
-
A Novel Pancreatic Cancer Hypoxia Status Related Gene Signature for Prognosis and Therapeutic Responses.Mol Biotechnol. 2024 Jul;66(7):1684-1703. doi: 10.1007/s12033-023-00807-x. Epub 2023 Jul 5. Mol Biotechnol. 2024. PMID: 37405638 Review.
-
Proposing a novel molecular subtyping scheme for predicting distant recurrence-free survival in breast cancer post-neoadjuvant chemotherapy with close correlation to metabolism and senescence.Front Endocrinol (Lausanne). 2023 Oct 12;14:1265520. doi: 10.3389/fendo.2023.1265520. eCollection 2023. Front Endocrinol (Lausanne). 2023. PMID: 37900131 Free PMC article. Review.
Cited by
-
CERCAM is a prognostic biomarker associated with immune infiltration of macrophage M2 polarization in head and neck squamous carcinoma.BMC Oral Health. 2023 Oct 7;23(1):724. doi: 10.1186/s12903-023-03421-0. BMC Oral Health. 2023. PMID: 37803318 Free PMC article.
-
Identification of a Novel Mesenchymal Stem Cell-Related Signature for Predicting the Prognosis and Therapeutic Responses of Bladder Cancer.Stem Cells Int. 2024 Nov 15;2024:6064671. doi: 10.1155/sci/6064671. eCollection 2024. Stem Cells Int. 2024. PMID: 39624211 Free PMC article.
-
Cancer-associated fibroblast-related gene signatures predict survival and drug response in patients with colorectal cancer.Front Genet. 2022 Nov 25;13:1054152. doi: 10.3389/fgene.2022.1054152. eCollection 2022. Front Genet. 2022. PMID: 36506313 Free PMC article.
-
An estrogen response-related signature predicts response to immunotherapy in melanoma.Front Immunol. 2023 May 12;14:1109300. doi: 10.3389/fimmu.2023.1109300. eCollection 2023. Front Immunol. 2023. PMID: 37251404 Free PMC article.
-
OSBPL10-CNBP axis mediates hypoxia-induced pancreatic cancer development.Biofactors. 2025 Jan-Feb;51(1):e2124. doi: 10.1002/biof.2124. Epub 2024 Sep 27. Biofactors. 2025. PMID: 39329194 Free PMC article.
References
MeSH terms
Substances
LinkOut - more resources
Full Text Sources
Medical
Research Materials
Miscellaneous