

Baricitinib therapy response in rheumatoid arthritis patients associates to STAT1 phosphorylation in monocytes
- PMID: 35958600
- PMCID: PMC9357974
- DOI: 10.3389/fimmu.2022.932240
Baricitinib therapy response in rheumatoid arthritis patients associates to STAT1 phosphorylation in monocytes
Abstract
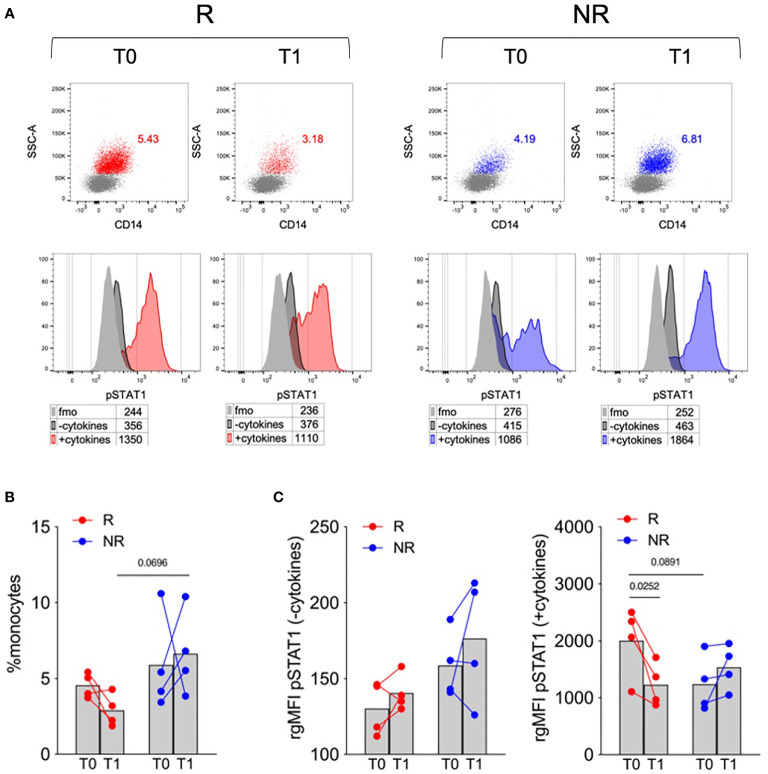
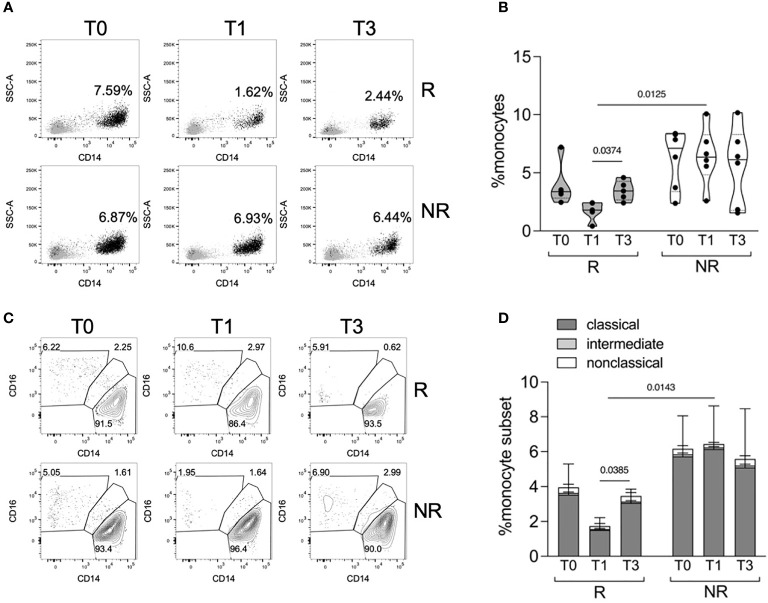
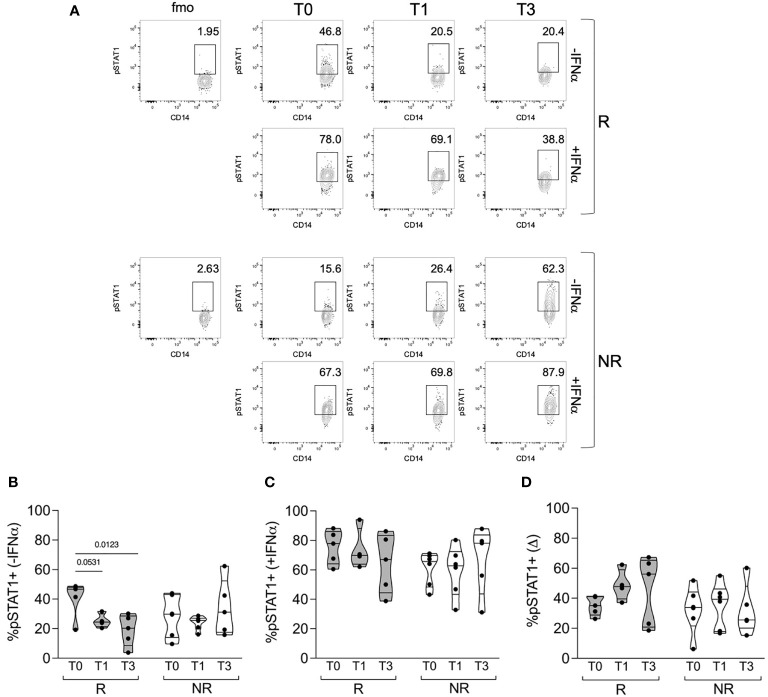
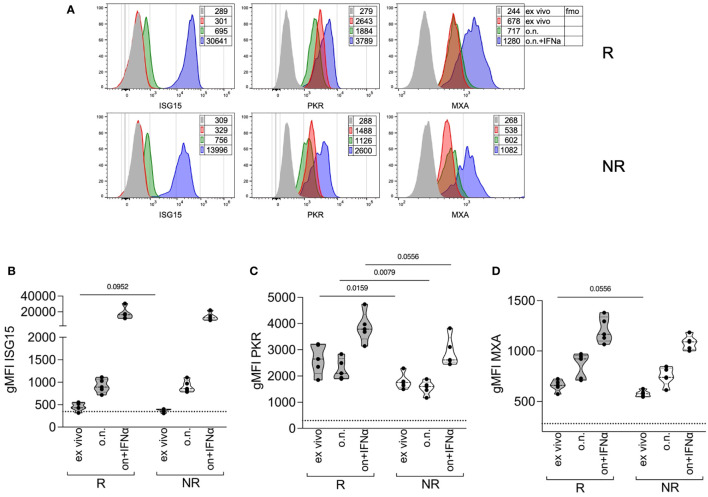
Baricitinib is a Janus kinase (JAK) 1 and 2 inhibitor approved for treating rheumatoid arthritis (RA). The JAK/STAT system is essential in the intracellular signaling of different cytokines and in the activation process of the monocyte lineage. This study verifies the effects of baricitinib on STAT phosphorylation in monocytes of RA patients and evaluates the correlation between STAT phosphorylation and response to therapy. We evaluated the disease activity of patients (DAS28CRP) at baseline (T0) and after 4 and 12 weeks (T1-T3) of treatment with baricitinib, dividing them into responders (n = 7) and non-responders (n = 7) based on the reduction of DAS28CRP between T0 and T1 of at least 1.2 points. Through flow cytometry, STAT1 phosphorylation was analyzed at T0/T1/T3 in monocytes, at basal conditions and after IL2, IFNα, and IL6 stimulation. We showed that monocyte frequency decreased from T0 to T1 only in responders. Regarding the phosphorylation of STAT1, we observed a tendency for higher basal pSTAT1 in monocytes of non-responder patients and, after 4 weeks, a significant reduction of cytokine-induced pSTAT1 in monocytes of responders compared with non-responders. The single IFNα stimulation only partially recapitulated the differences in STAT1 phosphorylation between the two patient subgroups. Finally, responders showed an increased IFN signature at baseline compared with non-responders. These results may suggest that monocyte frequency and STAT1 phosphorylation in circulating monocytes could represent early markers of response to baricitinib therapy.
Keywords: ISGs; JAKi; STAT; interferon; monocytes; rheumatoid arthritis.
Copyright © 2022 Tucci, Garufi, Pacella, Zagaglioni, Pinzon Grimaldos, Ceccarelli, Conti, Spinelli and Piconese.
Conflict of interest statement
CG, FCo and FS received speaker fees from Eli Lilly. The remaining authors declare that the research was conducted in the absence of any commercial or financial relationships that could be construed as a potential conflict of interest.
Figures
Similar articles
-
The Janus kinase inhibitor (baricitinib) suppresses the rheumatoid arthritis active marker gliostatin/thymidine phosphorylase in human fibroblast-like synoviocytes.Immunol Res. 2022 Apr;70(2):208-215. doi: 10.1007/s12026-022-09261-4. Epub 2022 Jan 10. Immunol Res. 2022. PMID: 35014010 Free PMC article.
-
Inhibition of JAK-STAT Signaling by Baricitinib Reduces Interferon-γ-Induced CXCL10 Production in Human Salivary Gland Ductal Cells.Inflammation. 2021 Feb;44(1):206-216. doi: 10.1007/s10753-020-01322-w. Inflammation. 2021. PMID: 32772240
-
Elevated STAT1 expression but not phosphorylation in lupus B cells correlates with disease activity and increased plasmablast susceptibility.Rheumatology (Oxford). 2020 Nov 1;59(11):3435-3442. doi: 10.1093/rheumatology/keaa187. Rheumatology (Oxford). 2020. PMID: 32357246
-
Baricitinib: From Rheumatoid Arthritis to COVID-19.J Clin Pharmacol. 2021 Oct;61(10):1274-1285. doi: 10.1002/jcph.1874. Epub 2021 Jun 12. J Clin Pharmacol. 2021. PMID: 33870531 Free PMC article. Review.
-
Baricitinib: The Second FDA-Approved JAK Inhibitor for the Treatment of Rheumatoid Arthritis.Ann Pharmacother. 2019 Sep;53(9):947-953. doi: 10.1177/1060028019839650. Epub 2019 Mar 24. Ann Pharmacother. 2019. PMID: 30907116 Review.
Cited by
-
Evolving cognition of the JAK-STAT signaling pathway: autoimmune disorders and cancer.Signal Transduct Target Ther. 2023 May 19;8(1):204. doi: 10.1038/s41392-023-01468-7. Signal Transduct Target Ther. 2023. PMID: 37208335 Free PMC article. Review.
-
JAK Inhibitors in Rheumatoid Arthritis: Immunomodulatory Properties and Clinical Efficacy.Int J Mol Sci. 2024 Jul 30;25(15):8327. doi: 10.3390/ijms25158327. Int J Mol Sci. 2024. PMID: 39125897 Free PMC article. Review.
-
Unveiling the Nexus: Cellular Metabolomics Unravels the Impact of Estrogen on Nicotinamide Metabolism in Mitigating Rheumatoid Arthritis Pathogenesis.Metabolites. 2024 Apr 11;14(4):214. doi: 10.3390/metabo14040214. Metabolites. 2024. PMID: 38668342 Free PMC article.
-
Advances of the small molecule drugs regulating fibroblast-like synovial proliferation for rheumatoid arthritis.Front Pharmacol. 2023 Jul 21;14:1230293. doi: 10.3389/fphar.2023.1230293. eCollection 2023. Front Pharmacol. 2023. PMID: 37547337 Free PMC article. Review.
-
Study on Potential Differentially Expressed Genes in Idiopathic Pulmonary Fibrosis by Bioinformatics and Next-Generation Sequencing Data Analysis.Biomedicines. 2023 Nov 21;11(12):3109. doi: 10.3390/biomedicines11123109. Biomedicines. 2023. PMID: 38137330 Free PMC article.
References
MeSH terms
Substances
LinkOut - more resources
Full Text Sources
Medical
Research Materials
Miscellaneous