. 2022 Jul 25:13:945222.
doi: 10.3389/fimmu.2022.945222. eCollection 2022.

Development of mouse model for oral allergy syndrome to identify IgE cross-reactive pollen and food allergens: ragweed pollen cross-reacts with fennel and black pepper

Affiliations

Development of mouse model for oral allergy syndrome to identify IgE cross-reactive pollen and food allergens: ragweed pollen cross-reacts with fennel and black pepper

Anna Kamei et al. Front Immunol. .

Abstract

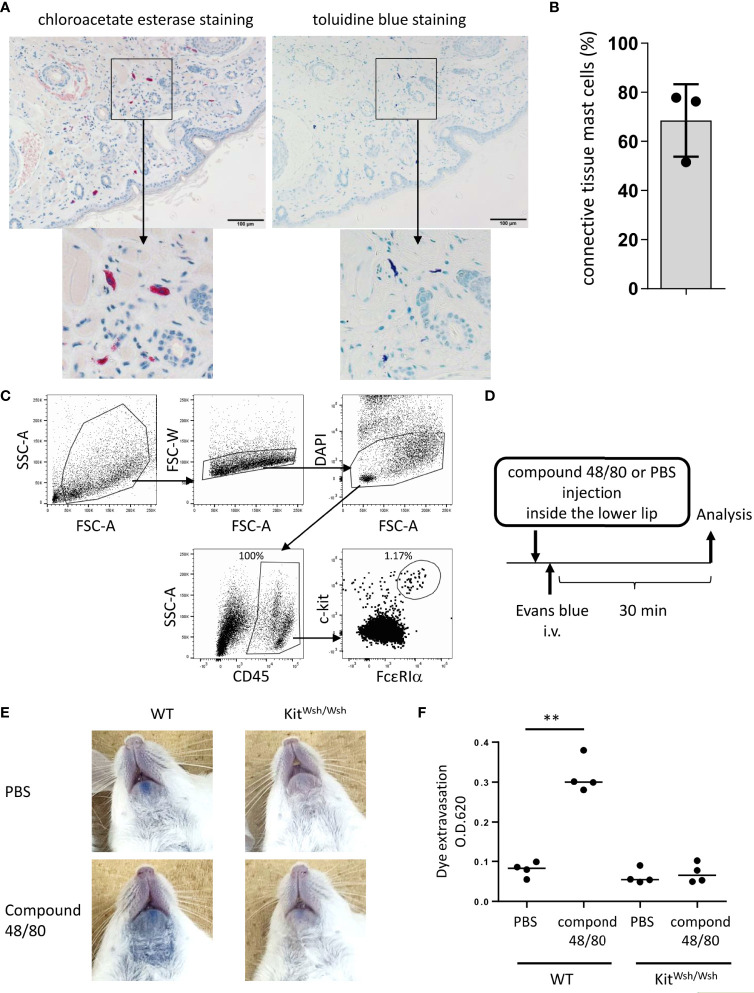
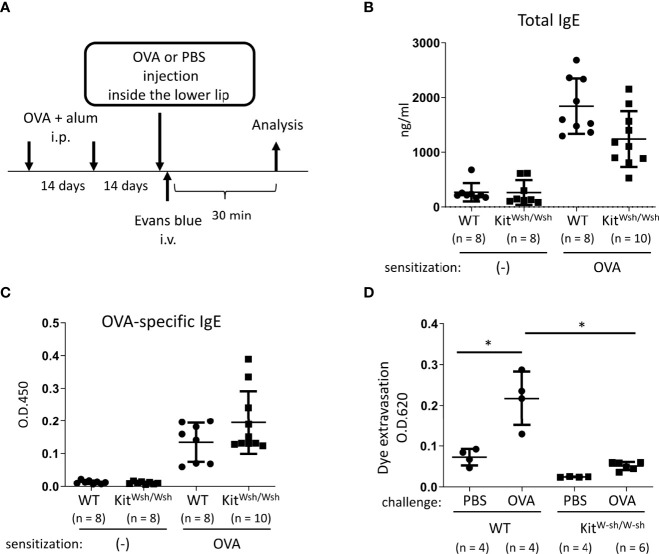
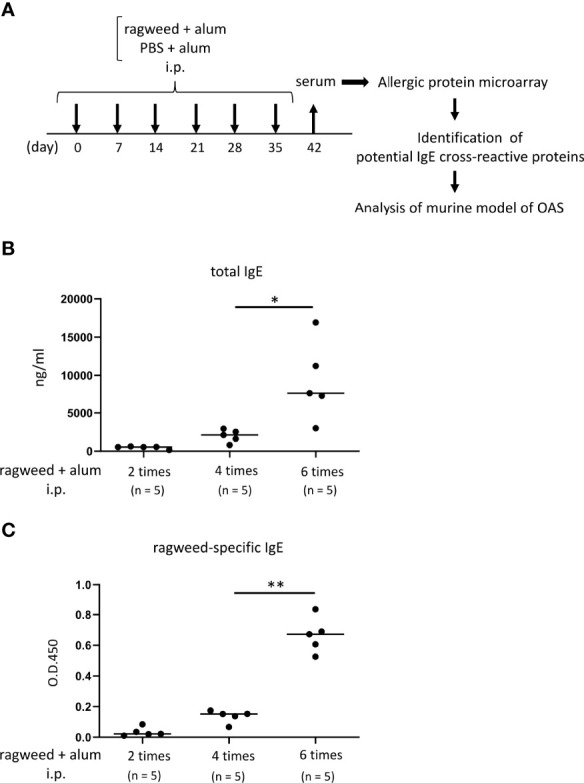
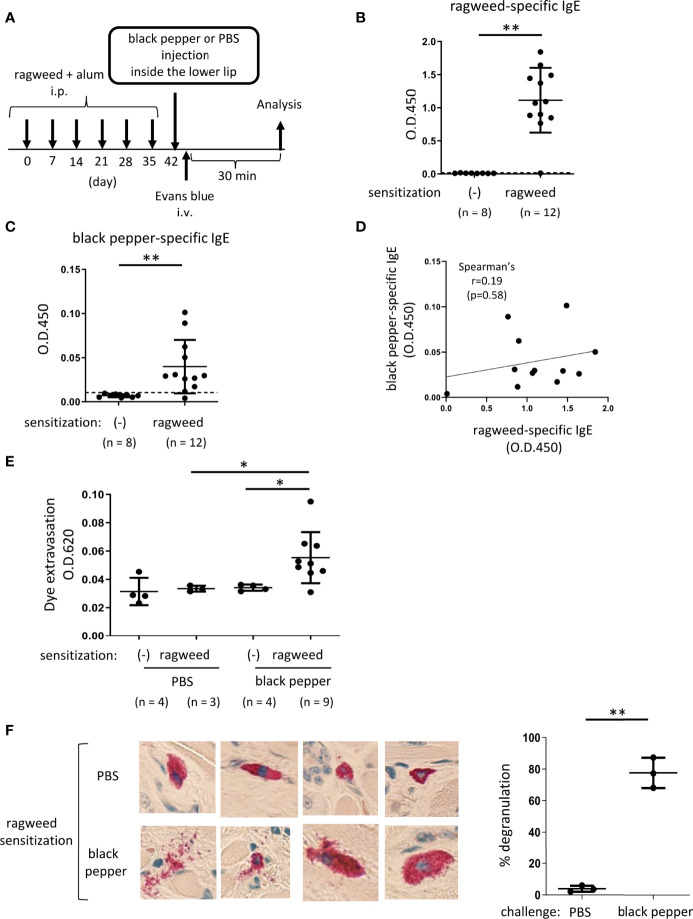
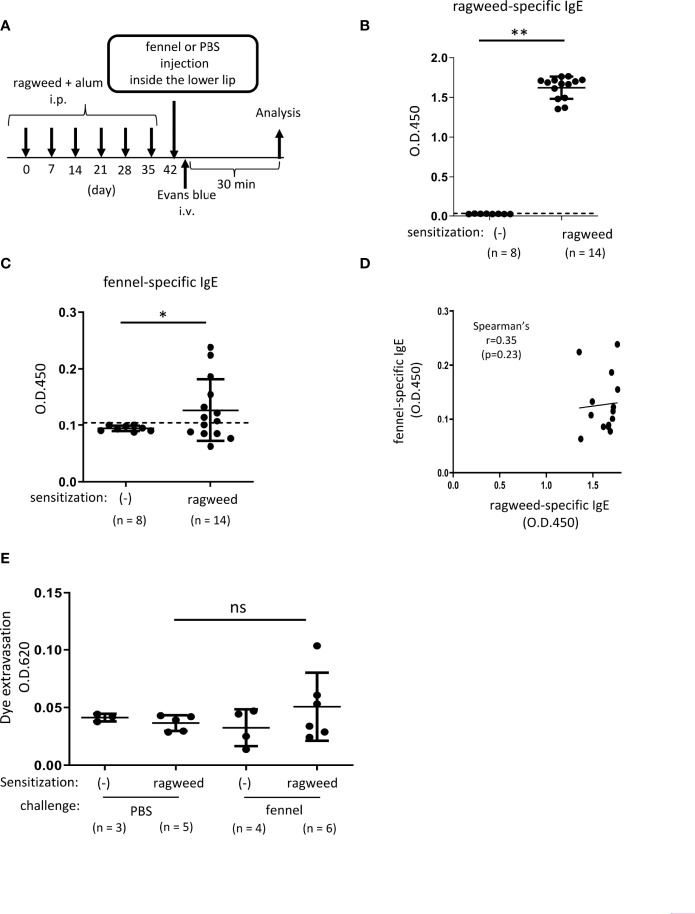
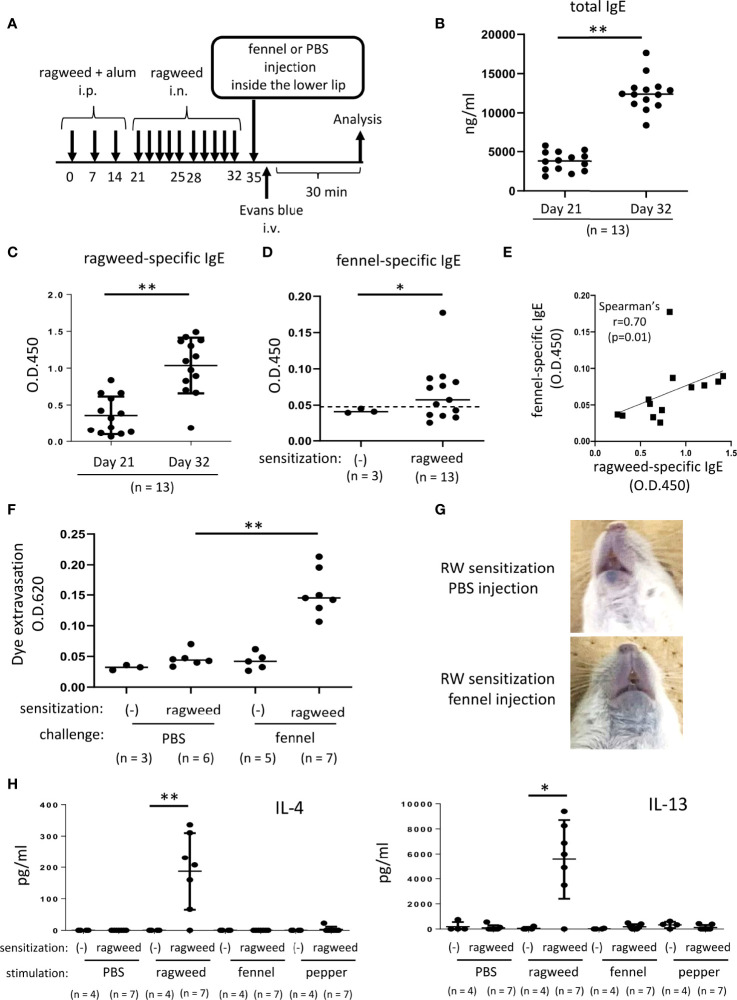
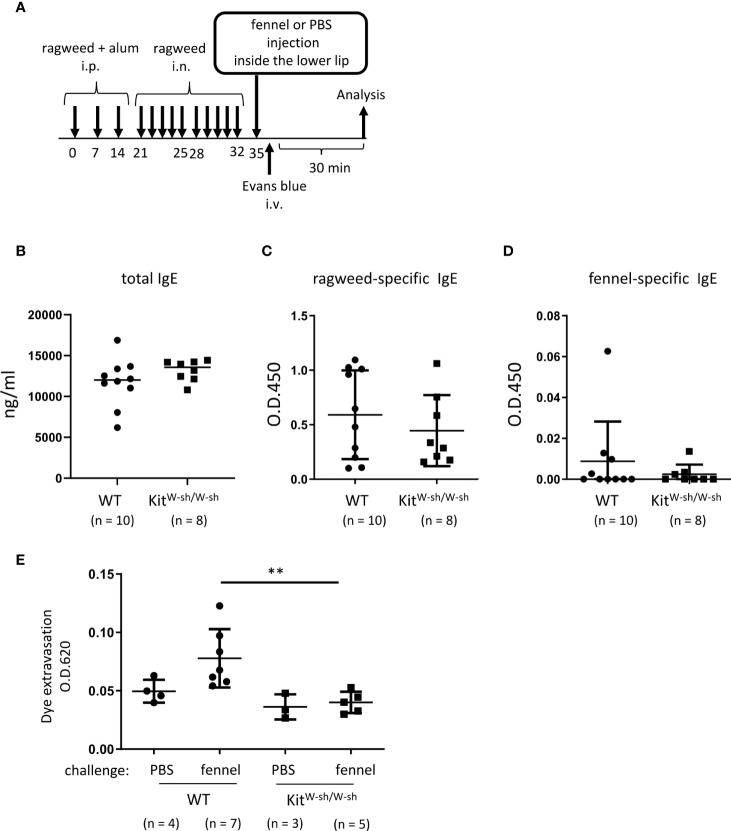
Oral allergy syndrome (OAS) is an IgE-mediated immediate food allergy that is localized to the oral mucosa. Pollen food allergy syndrome (PFAS), a pollinosis-associated OAS, is caused by cross-reactivity between food and pollen allergens. However, we need to more precisely understand the underlying pathogenesis of OAS/PFAS. In the present study, we developed a method to comprehensively identify cross-reactive allergens by using murine model of OAS and protein microarray technology. We focused on lip angioedema, which is one of the most common symptoms of OAS, and confirmed that mast cells reside in the tissues inside the lower lip of the mice. Interestingly, when the food allergen ovalbumin (OVA) was injected inside the lower lip of mice with high levels of OVA-specific IgE followed by an intravenous injection of the Evans blue dye, we found immediate dye extravasation in the skin of the neck in a mast cell-dependent manner. In addition, the degree of mast cell degranulation in the oral cavity, reflecting the severity of oral allergic responses, can be estimated by measuring the amount of extravasated dye in the skin. Therefore, we used this model of OAS to examine IgE cross-reactive allergens in vivo. Protein microarray analysis showed that serum IgE from mice intraperitoneally sensitized with ragweed pollen, one of the major pollens causing pollinosis, bound highly to protein extracts from several edible plants including black peppercorn and fennel. We confirmed that the levels of black pepper-specific IgE and fennel-specific IgE were significantly higher in the serum from ragweed pollen-sensitized mice than in the serum from non-sensitized control mice. Importantly, analysis of murine model of OAS showed that the injection of black pepper or fennel extract induced apparent oral allergic responses in ragweed pollen-sensitized mice. These results indicate IgE cross-reactivity of ragweed pollen with black pepper and fennel. In conclusion, we developed mouse model of OAS to identify IgE cross-reactive pollen and food allergens, which will help understand the pathogenesis of OAS/PFAS.

Keywords: IgE; allergen; cross-reactivity; food; mouse model; oral allergy syndrome (OAS); pollen.


Conflict of interest statement

The authors declare that the research was conducted in the absence of any commercial or financial relationships that could be constructed as a potential conflict of interest.

Figures

Figure 1
Figure 1
Development of murine model of pseudo-allergic reaction in the oral cavity. (A, B) Chloroacetate esterase staining or toluidine blue staining of serial tissue sections in the inside of the lower lip from Balb/c mice (n = 3) under steady conditions. (A) Chloroacetate esterase-stained (left panel) or toluidine blue-stained (right panel) mast cells are seen. (B) The percentage of both chloroacetate esterase- and toluidine blue-stained mast cells among chloroacetate esterase-stained mast cells. The total count was 59, 33, or 45 mast cells in serial tissue sections from three mice. Data are representative of two independent experiments. (C) Surface expression levels of FcεRIα and c-Kit among CD45+ hematopoietic cells in the inside tissue of the lower lip from Balb/c mice under steady conditions. FcεRIα+c-Kit+ mast cell populations (1.17%) among CD45+ cells (100%) were seen. Data are representative of three independent experiments. (D) A schematic representation of murine models of compound 48/80-induced pseudo-allergic reaction in oral cavities. (E) Injection of compound 48/80 inside the lower lip caused dye extravasation in the skin from WT mice but not from KitW-sh/W-sh mice. Representative pictures of the neck skin from WT mice injected with compound 48/80 (left/lower) or PBS (left/upper) and from KitW-sh/W-sh mice injected with compound 48/80 (right/lower) or PBS (right/upper) (F) Quantification of the Evans blue dye that extravasated into the neck skin from WT or KitW-sh/W-sh mice injected with compound 48/80 or PBS. n =4 per group; data are presented as mean ± SD. Data are representative of two independent experiments. Brown-Forsythe and Welch ANOVA with Dunnett T3 multiple comparisons. **P < 0.01.
Figure 2
Figure 2
Development of murine model of IgE- and mast cell-mediated allergic reaction in oral cavities. (A) A schematic representation of murine models of OVA-induced, IgE- and mast cell-dependent allergic reaction in oral cavities. (B, C) Serum levels of total IgE (B) and OVA-specific IgE (C) from WT mice (n = 8) or KitW-sh/W-sh mice (n = 10) intraperitoneally injected with OVA plus alum twice at a 2-week interval or from non-sensitized WT mice (n = 8) or KitW-sh/W-sh mice (n = 8). (D) Quantification of the Evans blue dye that extravasated into the neck skin from OVA-sensitized WT mice stimulated by OVA (n = 4) or PBS (n = 4) or KitW-sh/W-sh mice stimulated by OVA (n = 6) or PBS (n = 4). Data are presented as mean ± SD. Data are representative of two independent experiments. Brown-Forsythe and Welch ANOVA with Dunnett T3 multiple comparisons. *P < 0.05.
Figure 3
Figure 3
Identification of foods that may cross-react with ragweed pollen by using murine model of sensitization with ragweed pollen and allergenic protein microarray technology. (A) Allergenic protein microarray analysis was performed using serum from mice given intraperitoneal administration of ragweed pollen plus alum or PBS plus alum as a control, before analysis of murine model of OAS. (B, C) Balb/c mice (n = 5) were intraperitoneally injected with ragweed pollen plus alum six times at a 1- week interval. Serum levels of total IgE (B) and ragweed-specific IgE (C) from Balb/c mice after two, four or six times of intraperitoneal injection of ragweed pollen plus alum. Data are presented as mean ± SD. Data are representative of two independent experiments. Brown-Forsythe and Welch ANOVA with Dunnett T3 multiple comparisons. *P < 0.05; **P < 0.01.
Figure 4
Figure 4
Ragweed pollen cross-reacts with black pepper in murine model of OAS. (A) A schematic representation of murine model of OAS. WT mice intraperitoneally sensitized with ragweed pollen before stimulation with black pepper or PBS as a control. (B-D) Serum levels of ragweed-specific (B) and black pepper-specific IgE (C) from ragweed-sensitized mice at day 42 (n = 12) or non-sensitized control mice (n = 8). (B and C) A positivity threshold (mean + 2SD in non-sensitized mice) is shown as a dotted line. Data are presented as mean ± SD. Data are representative of two independent experiments. Welch’s t-test. **P < 0.01. (D) No correlation between serum levels of ragweed-specific IgE and black pepper-specific IgE from ragweed-sensitized mice (n =12). Spearman’s correlation test. (E) Quantification of the Evans blue dye that extravasated into the neck skin from ragweed-sensitized mice stimulated by black pepper extract (n = 9) or PBS (n = 3) or from non-sensitized control mice stimulated by black pepper extract (n = 4) or PBS (n = 4). Data are presented as mean ± standard deviation. Data are representative of two independent experiments. Brown-Forsythe and Welch ANOVA with Dunnett T3 multiple comparisons. *P < 0.05. (F) Representative images of images of chloroacetate esterase-stained mast cells in tissue sections in the inside of the lower lip from ragweed-sensitized mice stimulated by black pepper extract (left/lower panel) or PBS (left/upper panel). Percentages of degranulated mast cells were shown (right). n = 3 per each group. Data are presented as mean ± SD. Data are representative of two independent experiments. Welch’s t-test. **P < 0.01.
Figure 5
Figure 5
Stimulation with fennel extracts did not significantly induce OAS in mice intraperitoneally sensitized with ragweed pollen in murine model. (A) A schematic representation of murine model of OAS. WT mice intraperitoneally sensitized with ragweed pollen before stimulation with fennel or PBS as a control. (B-D) Serum levels of ragweed-specific IgE (B) and fennel-specific IgE (C) from mice intraperitoneally sensitized with ragweed pollen at day 42 (n = 14) or non-sensitized control mice (n = 8). (B, C) A positivity threshold (mean + 2SD in non-sensitized mice) is shown as a dotted line. Data are expressed as mean ± SD. Data are representative of two independent experiments. Welch’s t-test. **P < 0.01. (D) No correlation between serum levels of ragweed-specific IgE and fennel-specific IgE from ragweed-sensitized mice (n = 14). Spearman’s correlation test. (E) Quantification of the Evans blue dye that extravasated into the neck skin from ragweed-sensitized WT mice stimulated by fennel extract (n = 6) or PBS (n = 5) or from non-sensitized control mice stimulated by fennel extract (n = 4) or PBS (n = 3). Data are expressed as mean ± SD. Data are representative of two independent experiments. Brown-Forsythe and Welch ANOVA with Dunnett T3 multiple comparisons. ns, not significant.
Figure 6
Figure 6
Stimulation with fennel extracts induced mast cell-dependent OAS in mice intraperitoneally and intranasally sensitized with ragweed pollen. (A) A schematic representation of murine model of OAS. WT mice intraperitoneally and intranasally sensitized with ragweed pollen before stimulation with fennel or PBS as a control. (B-D) Serum levels of total IgE (B) and ragweed-specific IgE (C) from ragweed-sensitized mice (n = 13) at day 21 and at day 32. (D) Serum levels of fennel-specific IgE from ragweed-sensitized mice (n = 13) at day 32 or from non-sensitized control mice (n = 3). A positivity threshold (mean + 2SD in non-sensitized mice) is shown as a dotted line. Data are expressed as mean ± SD. Data are representative of two independent experiments. Welch’s t-test. *P < 0.05; **P < 0.01. (E) A weak positive correlation between serum levels of ragweed-specific IgE and fennel-specific IgE from ragweed-sensitized mice (n = 13). Spearman’s correlation test. (F) Quantification of the Evans blue dye that extravasated into the neck skin from ragweed-sensitized mice stimulated by fennel extract (n = 7) or PBS (n = 6) or from non-sensitized control mice stimulated by fennel extract (n = 5) or PBS (n = 3). Data are expressed as mean ± SD. Data are representative of two independent experiments. Brown-Forsythe and Welch ANOVA with Dunnett T3 multiple comparisons. **P < 0.01. (G) Representative pictures of the neck skin from ragweed-sensitized mice stimulated by fennel extracts (lower panel) or PBS (upper panel). Data are representative of two independent experiments. (H) Levels of IL-4 (left) and IL-13 (right) in the culture supernatants from cervical LN cells from ragweed-sensitized mice (n = 7) or non-sensitized control mice (n = 4) in response to ragweed pollen, fennel, or black pepper extract. Data are expressed as mean ± SD. Data are representative of two independent experiments. Brown-Forsythe and Welch ANOVA with Dunnett T3 multiple comparisons. *P < 0.05; **P < 0.01.
Figure 7
Figure 7
Stimulation with fennel extracts induced mast cell-dependent OAS in mice intraperitoneally and intranasally sensitized with ragweed pollen. (A) A schematic representation of murine model of OAS. WT or KitW-sh/W-sh mice intraperitoneally and intranasally sensitized with ragweed pollen before stimulation with fennel or PBS as a control. (B-D) Serum levels of total IgE (B), ragweed-specific IgE (C), or fennel-specific IgE (D) from WT (n = 10) or KitW-sh/W-sh (n = 8) mice at day 35. (E) Quantification of the Evans blue dye that extravasated into the neck skin from ragweed-sensitized WT mice stimulated by fennel extracts (n = 7) or PBS (n = 4) or from KitW-sh/W-sh mice stimulated by fennel extracts (n = 5) or PBS (n = 3). Data are expressed as mean ± SD. Data are representative of two independent experiments. (B-D) Welch’s t-test. (E) Brown-Forsythe and Welch ANOVA with Dunnett T3 multiple comparisons. **P < 0.01.

Similar articles

Cited by

References

    1. Valenta R, Hochwallner H, Linhart B, Pahr S. Food allergies: the basics. Gastroenterology (2015) 148(6):1120–31.e4. doi: 10.1053/j.gastro.2015.02.006 - DOI - PMC - PubMed
    1. Tordesillas L, Berin MC, Sampson HA. Immunology of food allergy. Immunity (2017) 47(1):32–50. doi: 10.1016/j.immuni.2017.07.004 - DOI - PubMed
    1. Ebisawa M, Ito K, Fujisawa T. Committee for Japanese pediatric guideline for food allergy, the Japanese society of pediatric allergy and clinical immunology, the Japanese society of allergology. Japanese guidelines for food allergy 2017. Allergol Int (2017) 66(2):248–64. doi: 10.1016/j.alit.2017.02.001 - DOI - PubMed
    1. Hagemann PM, Nsiah-Dosu S, Hundt JE, Hartmann K, Orinska Z. Mechanisms of particles in sensitization, effector function and therapy of allergic disease. Front Immunol (2019) 10:1174. doi: 10.3389/fimmu.2019.01174 - DOI - PMC - PubMed
    1. Nakano N, Kitaura J. Mucosal mast cells as key effector cells in food allergies. Cells (2022) 11(3):329. doi: 10.3390/cells11030329 - DOI - PMC - PubMed

Publication types