

Detection of neutrophil extracellular traps in patient plasma: method development and validation in systemic lupus erythematosus and healthy donors that carry IRF5 genetic risk
- PMID: 35958624
- PMCID: PMC9360330
- DOI: 10.3389/fimmu.2022.951254
Detection of neutrophil extracellular traps in patient plasma: method development and validation in systemic lupus erythematosus and healthy donors that carry IRF5 genetic risk
Abstract
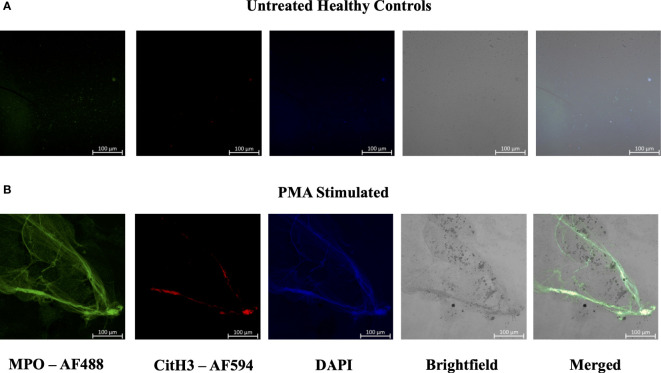
Neutrophil extracellular traps (NETs) are web-like structures extruded by neutrophils after activation or in response to microorganisms. These extracellular structures are decondensed chromatin fibers loaded with antimicrobial granular proteins, peptides, and enzymes. NETs clear microorganisms, thus keeping a check on infections at an early stage, but if dysregulated, may be self-destructive to the body. Indeed, NETs have been associated with autoimmune diseases such as systemic lupus erythematosus (SLE), rheumatoid arthritis (RA), antiphospholipid syndrome (APS), psoriasis, and gout. More recently, increased NETs associate with COVID-19 disease severity. While there are rigorous and reliable methods to quantify NETs from neutrophils via flow cytometry and immunofluorescence, the accurate quantification of NETs in patient plasma or serum remains a challenge. Here, we developed new methodologies for the quantification of NETs in patient plasma using multiplex ELISA and immunofluorescence methodology. Plasma from patients with SLE, non-genotyped healthy controls, and genotyped healthy controls that carry either the homozygous risk or non-risk IRF5-SLE haplotype were used in this study. The multiplex ELISA using antibodies detecting myeloperoxidase (MPO), citrullinated histone H3 (CitH3) and DNA provided reliable detection of NETs in plasma samples from SLE patients and healthy donors that carry IRF5 genetic risk. An immunofluorescence smear assay that utilizes only 1 µl of patient plasma provided similar results and data correlate to multiplex ELISA findings. The immunofluorescence smear assay is a relatively simple, inexpensive, and quantifiable method of NET detection for small volumes of patient plasma.
Keywords: ELISA; NETosis; immunofluorescence; quantification; smear assay.
Copyright © 2022 Matta, Battaglia and Barnes.
Conflict of interest statement
The authors declare that the research was conducted in the absence of any commercial or financial relationships that could be construed as a potential conflict of interest.
Figures


Similar articles
-
A New Methodology for the Quantification of Neutrophil Extracellular Traps in Patient Plasma.Bio Protoc. 2023 Jun 20;13(12):e4701. doi: 10.21769/BioProtoc.4701. eCollection 2023 Jun 20. Bio Protoc. 2023. PMID: 37397793 Free PMC article.
-
Caught in a Trap? Proteomic Analysis of Neutrophil Extracellular Traps in Rheumatoid Arthritis and Systemic Lupus Erythematosus.Front Immunol. 2019 Mar 11;10:423. doi: 10.3389/fimmu.2019.00423. eCollection 2019. Front Immunol. 2019. PMID: 30915077 Free PMC article.
-
The DNA sensors AIM2 and IFI16 are SLE autoantigens that bind neutrophil extracellular traps.Elife. 2022 May 24;11:e72103. doi: 10.7554/eLife.72103. Elife. 2022. PMID: 35608258 Free PMC article.
-
Neutrophil extracellular traps (NETs) in autoimmune diseases: A comprehensive review.Autoimmun Rev. 2017 Nov;16(11):1160-1173. doi: 10.1016/j.autrev.2017.09.012. Epub 2017 Sep 9. Autoimmun Rev. 2017. PMID: 28899799 Review.
-
Neutrophils-Important Communicators in Systemic Lupus Erythematosus and Antiphospholipid Syndrome.Front Immunol. 2019 Nov 22;10:2734. doi: 10.3389/fimmu.2019.02734. eCollection 2019. Front Immunol. 2019. PMID: 31824510 Free PMC article. Review.
Cited by
-
The role of extracellular traps in ischemia reperfusion injury.Front Immunol. 2022 Sep 20;13:1022380. doi: 10.3389/fimmu.2022.1022380. eCollection 2022. Front Immunol. 2022. PMID: 36211432 Free PMC article. Review.
-
Mitochondrial ROS and base excision repair steps leading to DNA nick formation drive ultraviolet induced-NETosis.Front Immunol. 2023 Jun 7;14:1198716. doi: 10.3389/fimmu.2023.1198716. eCollection 2023. Front Immunol. 2023. PMID: 37350954 Free PMC article.
-
Histone Modifications and DNA Methylation in Psoriasis: A Cellular Perspective.Clin Rev Allergy Immunol. 2025 Jan 27;68(1):6. doi: 10.1007/s12016-024-09014-1. Clin Rev Allergy Immunol. 2025. PMID: 39871086 Review.
-
Novel Methods for the Analysis of Serum NET Remnants: Evaluation in Patients with Severe COVID-19.Int J Mol Sci. 2025 Feb 28;26(5):2221. doi: 10.3390/ijms26052221. Int J Mol Sci. 2025. PMID: 40076841 Free PMC article.
-
Quantification of H3.1-nucleosomes using a chemiluminescent immunoassay: A reliable method for neutrophil extracellular trap detection.PLoS One. 2025 Aug 6;20(8):e0329352. doi: 10.1371/journal.pone.0329352. eCollection 2025. PLoS One. 2025. PMID: 40768414 Free PMC article.
References
-
- Rada B. Neutrophil extracellular traps. In: Knaus U, Leto T, editors. NADPH oxidases. methods in molecular biology, vol. 1982 . New York: Humana, New York; (2019). p. 517–528 p. Available at: http://www.springer.com/series/7651. - PMC - PubMed
Publication types
MeSH terms
Substances
Grants and funding
LinkOut - more resources
Full Text Sources
Other Literature Sources
Medical
Research Materials
Miscellaneous