

Dynamic prediction of mortality in COVID-19 patients in the intensive care unit: A retrospective multi-center cohort study
- PMID: 35958674
- PMCID: PMC9356569
- DOI: 10.1016/j.ibmed.2022.100071
Dynamic prediction of mortality in COVID-19 patients in the intensive care unit: A retrospective multi-center cohort study
Abstract
Background: The COVID-19 pandemic continues to overwhelm intensive care units (ICUs) worldwide, and improved prediction of mortality among COVID-19 patients could assist decision making in the ICU setting. In this work, we report on the development and validation of a dynamic mortality model specifically for critically ill COVID-19 patients and discuss its potential utility in the ICU.
Methods: We collected electronic medical record (EMR) data from 3222 ICU admissions with a COVID-19 infection from 25 different ICUs in the Netherlands. We extracted daily observations of each patient and fitted both a linear (logistic regression) and non-linear (random forest) model to predict mortality within 24 h from the moment of prediction. Isotonic regression was used to re-calibrate the predictions of the fitted models. We evaluated the models in a leave-one-ICU-out (LOIO) cross-validation procedure.
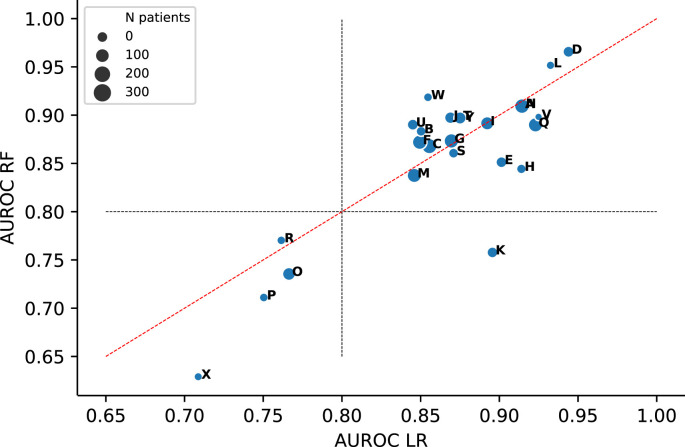
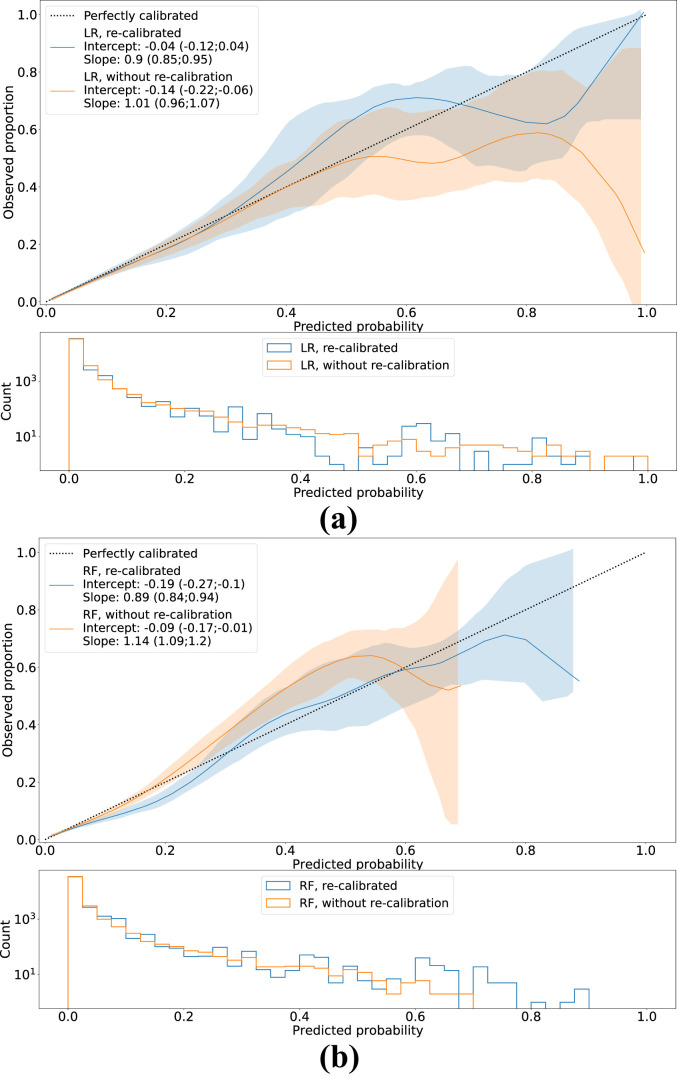
Results: The logistic regression and random forest model yielded an area under the receiver operating characteristic curve of 0.87 [0.85; 0.88] and 0.86 [0.84; 0.88], respectively. The recalibrated model predictions showed a calibration intercept of -0.04 [-0.12; 0.04] and slope of 0.90 [0.85; 0.95] for logistic regression model and a calibration intercept of -0.19 [-0.27; -0.10] and slope of 0.89 [0.84; 0.94] for the random forest model.
Discussion: We presented a model for dynamic mortality prediction, specifically for critically ill COVID-19 patients, which predicts near-term mortality rather than in-ICU mortality. The potential clinical utility of dynamic mortality models such as benchmarking, improving resource allocation and informing family members, as well as the development of models with more causal structure, should be topics for future research.
© 2022 The Authors.
Conflict of interest statement
The authors declare that they have no known competing financial interests or personal relationships that could have appeared to influence the work reported in this paper.
Figures
References
-
- Knaus W., Draper E., Wagner D., Zimmerman J. Apache II: a severity of disease classification system. Crit Care Med. 1985;13:818–828. - PubMed
-
- Le Gall J.R., Lemeshow S., Saulnier F. Simplified acute physiology score (SAPS II) based on a European/north American multicenter study. JAMA, J Am Med Assoc. 1993;270:2957–2963. - PubMed
-
- Thorsen-Meyer H.C., et al. Dynamic and explainable machine learning prediction of mortality in patients in the intensive care unit: a retrospective study of high-frequency data in electronic patient records. Lancet Digit Health. 2020;2:179–191. ISSN: 25897500. - PubMed
-
- Meyer A., et al. Machine learning for real-time prediction of complications in critical care: a retrospective study. Lancet Respir Med. 2018;6:905–914. ISSN: 22132619. - PubMed
LinkOut - more resources
Full Text Sources