. 2022 Jul 6;7(7):658-677.
doi: 10.1016/j.jacbts.2022.02.018. eCollection 2022 Jul.

Right Heart Failure in Mice Upon Pressure Overload Is Promoted by Mitochondrial Oxidative Stress

Affiliations

Right Heart Failure in Mice Upon Pressure Overload Is Promoted by Mitochondrial Oxidative Stress

Marion Müller et al. JACC Basic Transl Sci. .

Abstract

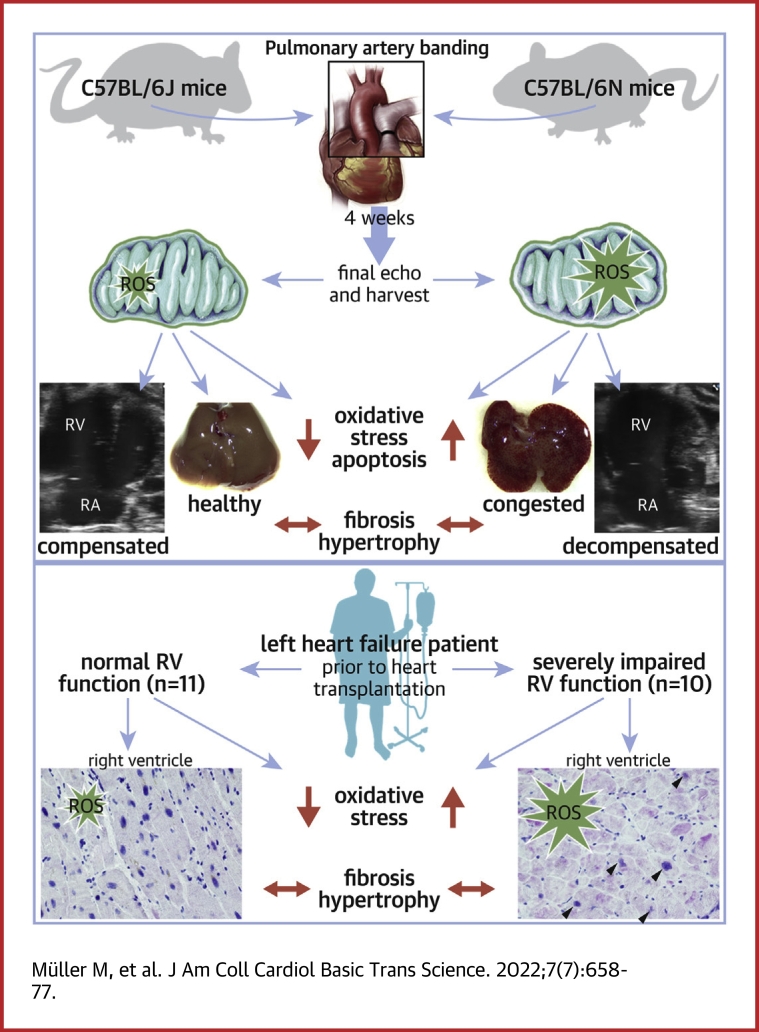
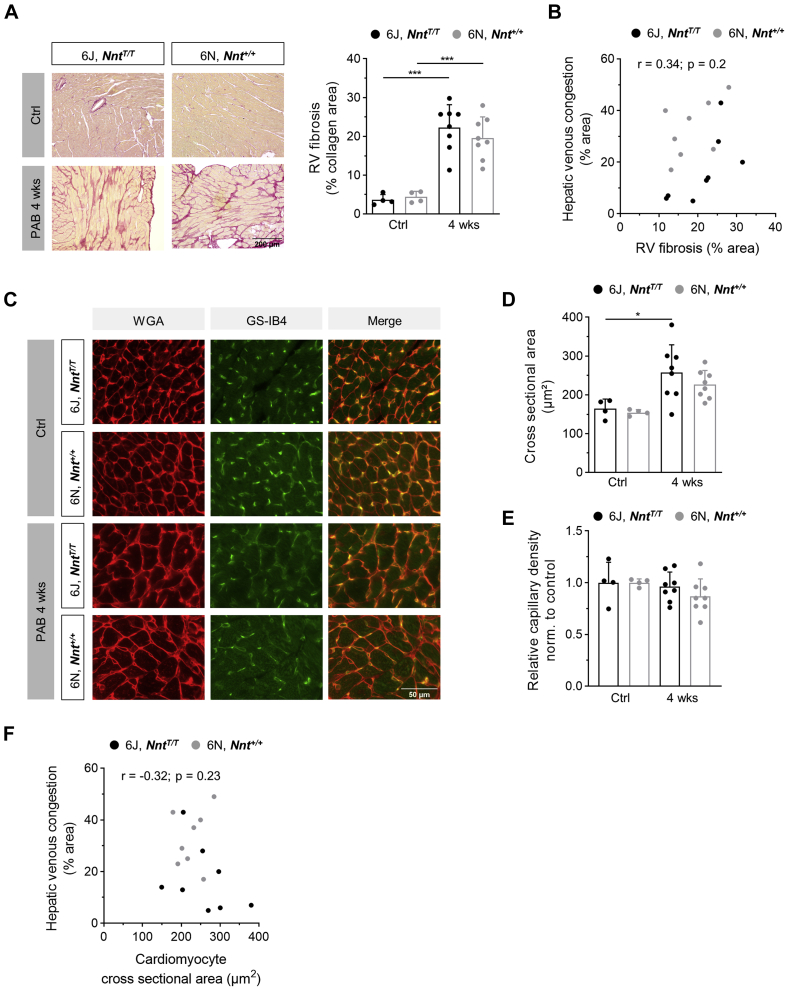
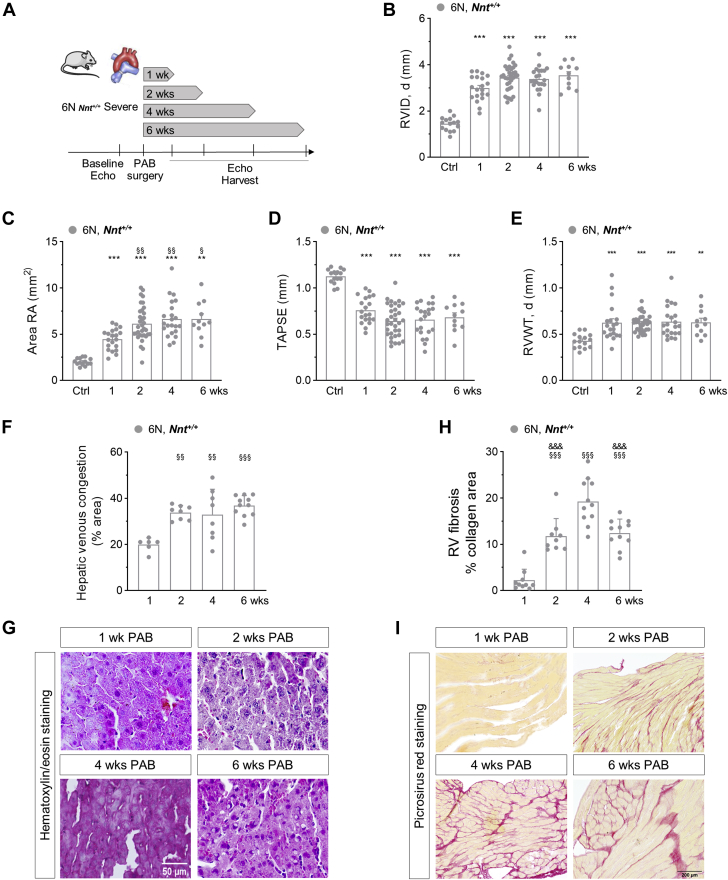
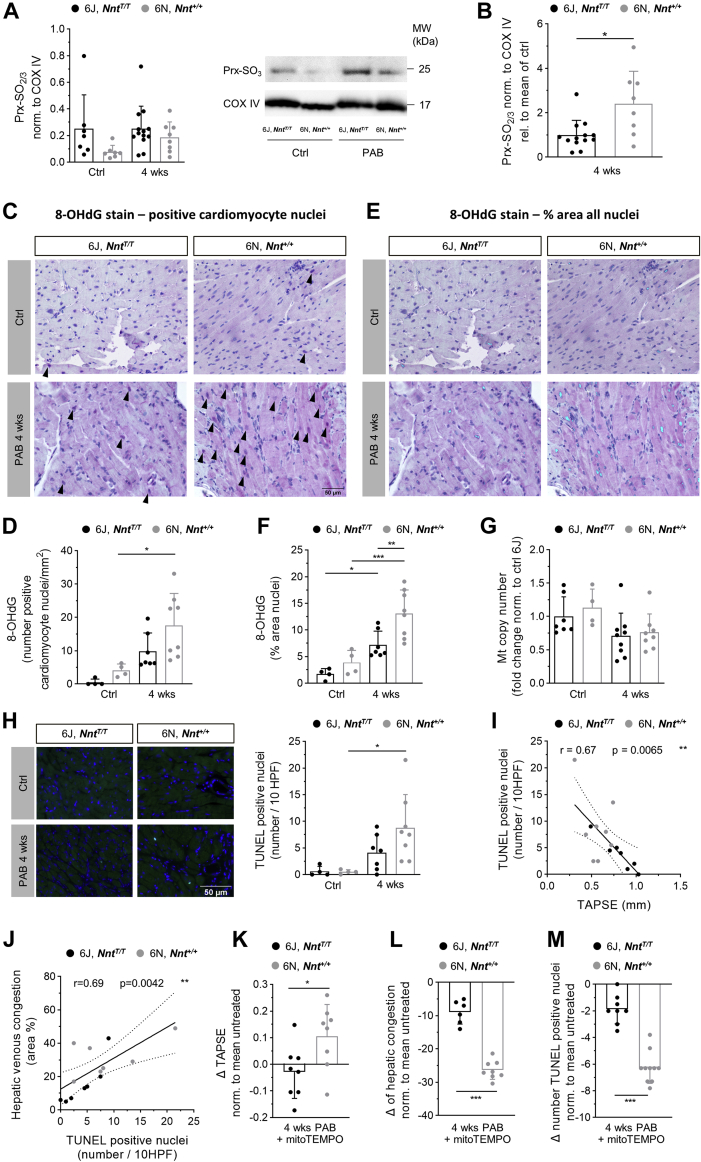
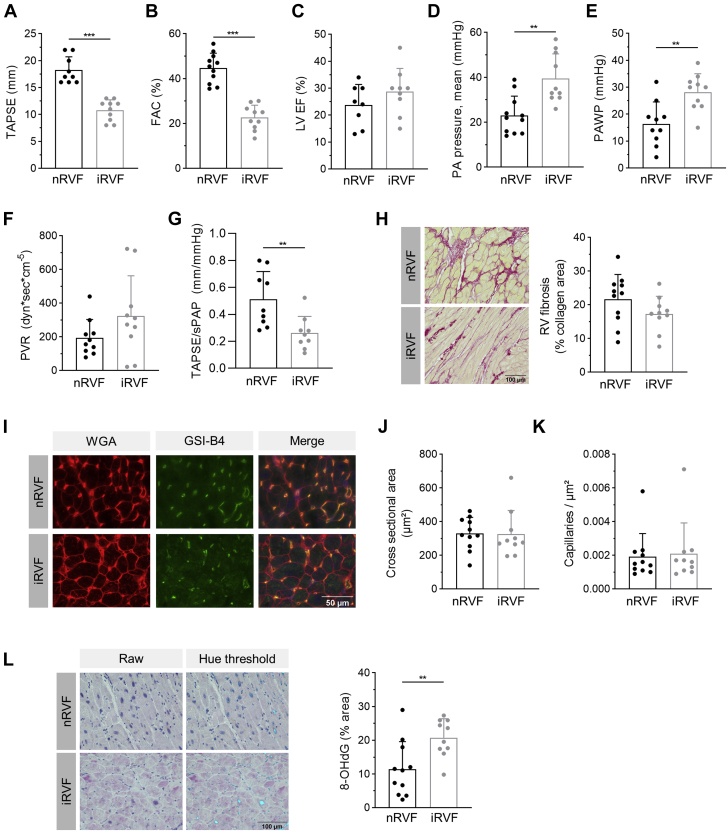
We sought to unravel pathomechanisms of the transition of maladaptive right ventricular (RV) remodeling to right heart failure (RHF) upon pressure overload. Exposure of C57BL/6J and C57BL/6N mice to pulmonary artery banding disclosed a tight relation of structural remodeling with afterload, but a dissociation from RV systolic function. Reduced release of mitochondrial reactive oxygen species in C57BL/6J mice prevented the development of RHF. In patients with left heart failure, increased oxidative damage in RV sections was associated with severely impaired RV function. In conclusion, reactive oxygen species are involved in the transition of maladaptive RV remodeling to RHF.

Keywords: 6J, C57BL/6J; 6N, C57BL/6N; NNT, nicotinamide nucleotide transhydrogenase; PAB, pulmonary artery banding; RHF, right heart failure; RVD, right ventricular dysfunction; RVH, right ventricular hypertrophy; TAPSE, tricuspid annular plane systolic excursion; iRVF, severely impaired right ventricular function; nRVF, normal right ventricular function; oxidative stress; pressure overload; pulmonary artery banding; reactive oxygen species; right heart failure.


Conflict of interest statement

This work was supported by the Deutsche Forschungsgemeinschaft, Bonn, Germany (RU 1678/3-3 to Dr Rudolph), by the Deutsche Stiftung für Herzforschung, Frankfurt a.M., Germany (F/ 48/ 20 to Drs Müller and Klinke) and by FoRUM, Bochum, Germany (F991R-21 to Drs Rudolph and Klinke). The authors have reported that they have no relationships relevant to the contents of this paper to disclose.

Figures

None
Graphical abstract
Figure 1
Figure 1
Right Ventricular Morphology and Function in 6J Mice Upon Pulmonary Artery Banding (A) Schematic illustration of experimental design. The pulmonary artery (PA) of mice was constricted to 450 μm (mild), 360 μm (moderate), or 300 μm (severe) using titanium clips. Right ventricular (RV) function and morphology were determined 2 weeks after pulmonary artery banding (PAB). (B) Representative 2-dimensional parasternal short-axis view of the constricted PA 3 days after PAB. Color Doppler visualizes blood flow, aortic valve (AV), pulmonic valve (PV), and proximal right ventricular outflow tract (pRVOT). (C) RV hypertrophy reflected by Fulton index (n = 10/8/9/10 mice) and diastolic right ventricular wall thickness (RVWT, d) (n = 13/8/9/10 mice) increased with increasing stenosis grade. (D) Representative M-mode images depicting assessment of RVWT, d and diastolic right ventricular inner diameter (RVID, d) of an untreated (Ctrl) and PAB-exposed mouse. (E) RVID, d and (F) right atrial (RA) area increased with stenosis grade of PAB (n = 13/8/9/10 mice). (G) Number of mice with paradoxical motion of interventricular septum was increased with increasing stenosis grade (n = 8/9/10 mice). (H) Representative 2-dimensional parasternal apical 4-chamber view of a control mouse and upon PAB with different stenosis grades. RA = right atrium. (I) Systolic RV function as revealed from tricuspid annular plane systolic excursion (TAPSE) was impaired with increasing stenosis degree (n = 13/8/9/10 mice). Statistical significance was calculated with 1-way analysis of variance followed by Bonferroni’s post hoc test for C and I, and with Kruskal-Wallis test followed by Dunn’s multicomparison test for E and F. ∗P < 0.05; ∗∗P < 0.01; ∗∗∗P < 0.001.
Figure 2
Figure 2
RV Function in 6J and 6N Mice Upon PAB (A) Representative genotyping of 6J and 6N mice by specific amplification of the nicotinamide nucleotide transhydrogenase (Nnt). 6J mice harbor an in-frame 5 exon deletion leading to a loss of exon 7-11. Primer pair 1 (PP1) is located within the coding sequence of exon 7-11, failing to be amplified in 6J mice. Primer pair 2 (PP2) is spanning exon 7-11, resulting in a truncated fragment in 6J mice compared with the wild type Nnt fragment amplified in 6N mice. (B) Schematic demonstration of NNT function. According to Nickel et al, the NNT switches from forward to reversed mode under cardiac pressure overload. (C) Schematic demonstration of experimental design. PAB was performed in 6J mice lacking the NNT (NntT/T) and 6N mice expressing functional active NNT (Nnt+/+). (D) RV hypertrophy as assessed by Fulton index (n = 11/4/10/9/13/8 mice) and diastolic RV wall thickness (n = 13/13/25/17/13/8 mice) was increased upon severe PAB after 2 and 4 weeks in 6J and 6N mice. Dilation of the RV (E) and the RA (F) was augmented in 6N compared with 6J mice upon 2 and 4 weeks of PAB (n = 13/13/25/17/13/8 mice). (G) RV function as assessed from TAPSE was more impaired in 6N vs 6J mice upon PAB after 2 and 4 weeks (n = 13/13/25/17/13/8 mice). (H) Representative image of speckle tracking in 2-dimensional parasternal apical 4-chamber view for longitudinal strain analysis using Vevo strain analysis module in 6J and 6N upon PAB. (I) Strain curves (top) and corresponding quantitative strain analysis represented as heat map (bottom) of 6J and 6N mice. (J) Schematic description of sections used for analysis of longitudinal straintotal and strain RVfree wall(left). A strain curve was calculated for every segment. The average of strain curves (bold symbols) and the SEM (thin symbols) demonstrating deformation of RV free wall of 6J and 6N mice upon 4 weeks of PAB. One representative animal per group is shown. (K) Longitudinal strain of the RV free wall was significantly diminished in 6N compared with 6J mice upon 4 weeks of PAB. Pk = peak (n= 9/7/8/7 mice). (L) Longitudinal displacement and (M) velocity of the RV free wall was significantly decreased in 6N compared with 6J mice upon 4 weeks of PAB (n = 9/7/8/7 mice). (N) Longitudinal strain of the RV free wall negatively correlated with TAPSE reflecting RV systolic function (n = 31 mice). Statistical significance in D (Fulton index) and K to M was calculated with 1-way analysis of variance, in D (RVWT, d) to G with a marginal linear mixed effect model, followed by Bonferroni’s post hoc test. For N, Pearson correlation was tested. ∗P < 0.05; ∗∗P < 0.01; ∗∗∗P < 0.001 compared with respective control; #P < 0.05; ##P < 0.01; ###P < 0.001 compared with corresponding 6J. Abbreviations as in Figure 1.
Figure 3
Figure 3
Characteristics of Right Heart Failure Upon PAB (A) Macroscopic and (B and C) microscopic signs of venous congestion in livers were more pronounced in 6N compared with 6J mice upon 4 weeks of PAB (n = 8-14 mice). Representative images of livers upon PAB (A) after excision and (B) of liver sections stained with hematoxylin/eosin. Pale areas indicate damage caused by venous congestion. Scale bar = 50 μm. (D) Receiver-operating characteristic (ROC) curve for the area of hepatic venous congestion (C) of 6J and 6N mice receiving a cutoff value of 21.5%. (E) TAPSE of 6J and 6N mice upon 4 weeks of PAB showed a significant negative correlation and (F) RA area showed a significant positive correlation with the extent of hepatic venous congestion as assessed in hematoxylin/eosin-stained liver sections (n = 15 mice). (G) Survival rate, excluding animals that died at the day of surgery, was lower within 4 weeks after PAB in 6N compared with 6J mice (n = 14/13 mice). Statistical significance in C was calculated with 2-tailed unpaired Student’s t-test and in G with log-rank test. For E and F, Pearson correlation was tested. ∗P < 0.05; ∗∗P < 0.01; ∗∗∗P < 0.001. Abbreviations as in Figure 1.
Figure 4
Figure 4
RV Remodeling in 6J and 6N Mice Upon Pulmonary Artery Banding (A) Representative images of picrosirius red stained RV sections (scale bar = 200 μm) and morphometric analysis of fibrotic area showing increased fibrosis in 6J and 6N mice upon PAB. (B) The extent of hepatic venous congestion did not correlate with RV fibrotic area in 6J and 6N mice upon 4 weeks of PAB (n = 16 mice). (C) Representative images of staining for cardiomyocyte cross-sectional area analysis using wheat germ agglutinin (WGA) and capillary density using isolectin of griffonia simplicifolia (GSI-B4). Scale bar = 50 μm. (D) Cross-sectional area of RV cardiomyocytes was not significantly different between 6J and 6N mice after 4 weeks of PAB. (E) Capillary density after 4 weeks of PAB in relation to the respective untreated animals of 6J and 6N mice shows slightly decreased density upon PAB in 6N compared with 6J mice. (F) The extent of hepatic venous congestion did not correlate with cardiomyocyte cross-sectional area in 6J and 6N mice upon 4 weeks of PAB (n = 16 mice). Statistical significance was calculated with 1-way analysis of variance followed by Bonferroni’s post hoc test for A, D and E. n = 4/4/8/8 mice. For Band F statistical significance for Pearson correlation was tested. ∗P < 0.05; ∗∗∗P < 0.001. Abbreviations as in Figure 1.
Figure 5
Figure 5
Temporal Development of RV Morphology, Function, and Failure in 6N Mice Upon PAB (A) Schematic demonstration of experimental design. PAB was performed in 6N mice expressing functional active NNT (Nnt+/+) and final organ harvest was performed at different time points. (B) RVID, d, (C) RA area, (D) TAPSE, and (E) RVWT, d were assessed after 1, 2, 4, and 6 weeks of PAB and were significantly increased after 1 week compared with baseline. (C) Area RA was further increased after 2, 4, and 6 weeks compared with 1 week, respectively (n = 15/20/34/22/11 mice). (F) Hepatic venous congestion as assessed from hematoxylin/eosin-stained sections (G) was significantly higher after 2, 4, and 6 weeks compared with 1 week of PAB (n = 6/9/8/11 mice). (H) The extent of RV fibrosis as assessed from picrosirius red-stained sections (I) was highest after 4 weeks of PAB (n = 6/9/8/11 mice). Statistical significance for B to E was calculated with a marginal linear mixed effect model and for F and H with 1-way analysis of variance followed by Bonferroni’s post hoc test. ∗∗P < 0.01; ∗∗∗P < 0.001 compared with respective control; §P < 0.05; §§P < 0.01; §§§P < 0.001 compared with the 1-week time point; &&&P < 0.001 compared with the 4 week time point. Abbreviations as in Figure 1.
Figure 6
Figure 6
Oxidative Stress-mediated Alterations in 6J and 6N Mice Upon Pulmonary Artery Banding Amount of hyperoxidized peroxiredoxin (Prx-SO2/3) in RV tissue normalized to protein expression of cyclooxygenase IV (COX IV) (A) was increased in 6N but not in 6J mice upon 4 weeks of PAB (n = 7/7/13/8 mice), and (B) the increase was significantly higher in 6N than in 6J mice as assessed by immunoblot (n = 13/8 mice). Oxidative DNA modifications as reflected by immunoreactivity for 8-hydroxydeoxyguanosin (8-OHdG) were (C and D) significantly increased in nuclei of cardiomyocytes upon 4 weeks of PAB compared with untreated in 6N mice, but not in 6J mice, and (E and F) were significantly more abundant in total nuclei of RV sections of 6N compared with 6J mice upon PAB (n = 4/4/7/8 mice). Arrowheads in C indicate cardiomyocyte nuclei, with 8-OHdG immunoreactivity in purple. Light blue color in E indicates immunoreactivity for 8-OHdG marked with ImageJ hue threshold analysis. Scale bar = 50 μm. (G) Mitochondrial (mt) copy number was slightly decreased upon PAB to the same extent in 6J and 6N mice (n = 7/4/9/8 mice). (H) Number of apoptotic nuclei calculated per 10 high-power fields (HPF) (40× magnification) as revealed from TUNEL staining was significantly increased in RV sections of 6N mice after 4 weeks of PAB, but not in 6J mice (n = 4/4/7/8 mice). Representative images of TUNEL-stained RV sections. Blue = DAPI; bright green = TUNEL positive. Scale bar = 50 μm. (I) Number of TUNEL positive nuclei show a mild linear negative correlation with systolic RV function (TAPSE) in 6J and 6N mice upon PAB. (J) Extent of histological signs of hepatic venous congestion shows a mild linear correlation with number of TUNEL-positive nuclei in 6J and 6N mice upon PAB. (K) Alteration of TAPSE after 4 weeks of PAB and treatment with mitoTEMPO in relation to the respective untreated PAB animals was significantly different in 6N compared with 6J mice (n = 8/8). (L) Reduction of areas with signs of venous congestion in livers after 4 weeks of PAB and treatment with mitoTEMPO in relation to the respective untreated PAB animals was significantly higher in 6N compared with 6J mice (n = 6/8). (M) Reduction of the number of TUNEL-positive nuclei in RV sections in mitoTEMPO-treated animals related to untreated mice upon 4 weeks of PAB was significantly higher in 6N compared with 6J mice (n = 8/10). Statistical significance was calculated with Kruskal-Wallis test followed by Dunn’s multicomparison test for A, with 1-way ANOVA followed by Bonferroni’s post hoc test for D to H, with Mann-Whitney U test for B and M, with 2-tailed unpaired Student's t-test for K and L, and tested for Pearson correlation for Iand J. ∗P < 0.05; ∗∗P < 0.01; ∗∗∗P < 0.001. Abbreviations as in Figure 1.
Figure 7
Figure 7
Remodeling and Oxidative Damage in RV Tissue of Patients With Dilated Cardiomyopathy Before Heart Transplantation Patients with dilated cardiomyopathy were divided into 2 groups with normal systolic right ventricular function (nRVF) and severely impaired right ventricular function (iRVF), exhibiting significant differences in (A) TAPSE (n = 9/10), (B) fractional area change (FAC) (n = 11/10), (D) mean pulmonary arterial (PA) pressure (n = 11/10), and (E) pulmonary artery wedge pressure (PAWP) (n = 11/10). (C) Systolic LV ejection fraction was reduced without differences between the 2 groups (n = 8/9). (F) Pulmonary vascular resistance (PVR) was markedly increased in iRVF patients (n = 11/10). (G) RV-PA coupling reflected by the ratio of TAPSE to systolic pulmonary artery pressure (sPAP) was significantly impaired in iRVF patients (n = 9/9). (H) Percentage of fibrotic area as assessed from picrosirius red staining (scale bar = 100 μm) was not different in RV of nRVF and iRVF patients (n = 11/10). (I) Representative images of RV sections stained for cardiomyocyte cross-sectional area analysis using wheat germ agglutinin (WGA) and capillary density using isolectin of griffonia simplicifolia (GSI-B4). Scale bar = 50 μm. (J) Cross-sectional area of cardiomyocytes was not different in RV of nRVF and iRVF patients (n = 11/10). (K) Capillary density was not different in RV of nRVF and iRVF patients (n = 11/10). (L) Oxidative DNA modifications as reflected by immunoreactivity for 8-hydroxydeoxyguanosin (8-OHdG) were significantly more abundant in nuclei of RV sections of patients with iRVF compared with nRVF (n = 11/10). Representative images, with purple nuclei indicating immunoreactivity for 8-OHdG (raw) and light blue color (hue threshold) indicates 8-OHdG immunoreactivity marked with ImageJ hue threshold analysis. Scale bar = 100 μm. Statistical significance was calculated with unpaired Student's t-test for A to G and L and with Mann-Whitney U test for J and K. ∗∗P < 0.01; ∗∗∗P < 0.001. Variation of n from nRVF/iRVF = 11/10 was caused by impossibility of assessment during echocardiography or catheterization for some of the parameters. Abbreviations as in Figure 1.

Similar articles

Cited by

References

    1. Konstam M.A., Kiernan M.S., Bernstein D., et al. for the American Heart Association Council on Clinical Cardiology. Council on Cardiovascular Disease in the Young, and Council on Cardiovascular Surgery and Anesthesia Evaluation and management of right-sided heart failure: a scientific statement from the American Heart Association. Circulation. 2018;137:e578–e622. - PubMed
    1. Reddy S., Bernstein D. Molecular mechanisms of right ventricular failure. Circulation. 2015;132:1734–1742. - PMC - PubMed
    1. Veeroju S., Mamazhakypov A., Rai N., et al. Effect of p53 activation on experimental right ventricular hypertrophy. PLoS One. 2020;15 - PMC - PubMed
    1. Heitmeier T., Sydykov A., Lukas C., et al. Altered proteasome function in right ventricular hypertrophy. Cardiovasc Res. 2020;116:406–415. - PubMed
    1. Bogaard H.J., Natarajan R., Henderson S.C., et al. Chronic pulmonary artery pressure elevation is insufficient to explain right heart failure. Circulation. 2009;120(20):1951–1960. - PubMed

LinkOut - more resources