. 2022 Jul;11(7):929-942.
doi: 10.21037/tau-21-1082.

Two-dimensional correlated spectroscopy distinguishes clear cell renal cell carcinoma from other kidney neoplasms and non-cancer kidney

Affiliations

Two-dimensional correlated spectroscopy distinguishes clear cell renal cell carcinoma from other kidney neoplasms and non-cancer kidney

Sharon J Del Vecchio et al. Transl Androl Urol. 2022 Jul.

Abstract

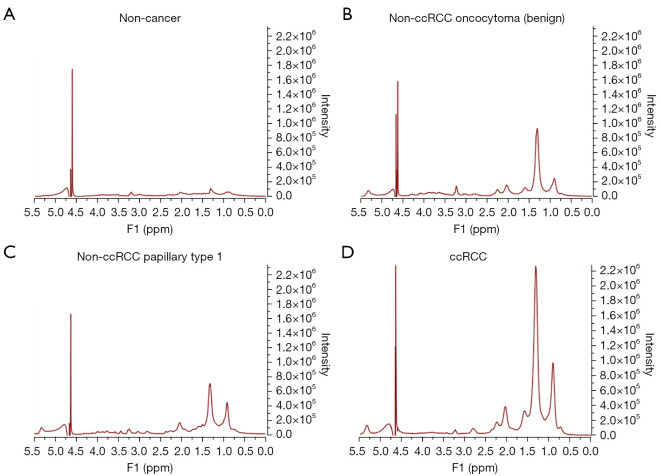
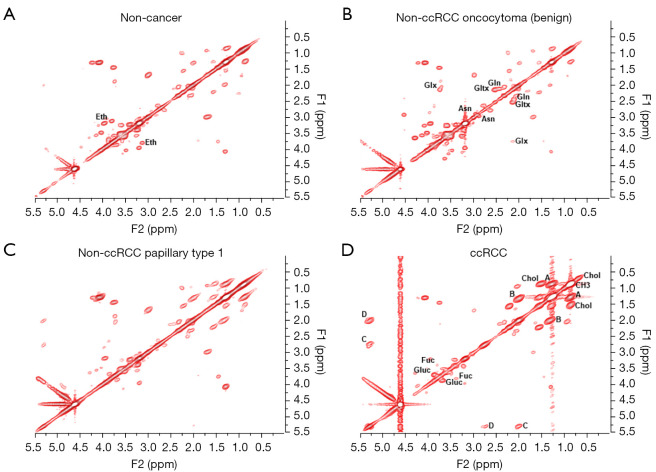
Background: Routinely used clinical scanners, such as computed tomography (CT), magnetic resonance imaging (MRI) and ultrasound (US), are unable to distinguish between aggressive and indolent tumor subtypes in masses localized to the kidney, often leading to surgical overtreatment. The results of the current investigation demonstrate that chemical differences, detected in human kidney biopsies using two-dimensional COrrelated SpectroscopY (2D L-COSY) and evaluated using multivariate statistical analysis, can distinguish these subtypes.

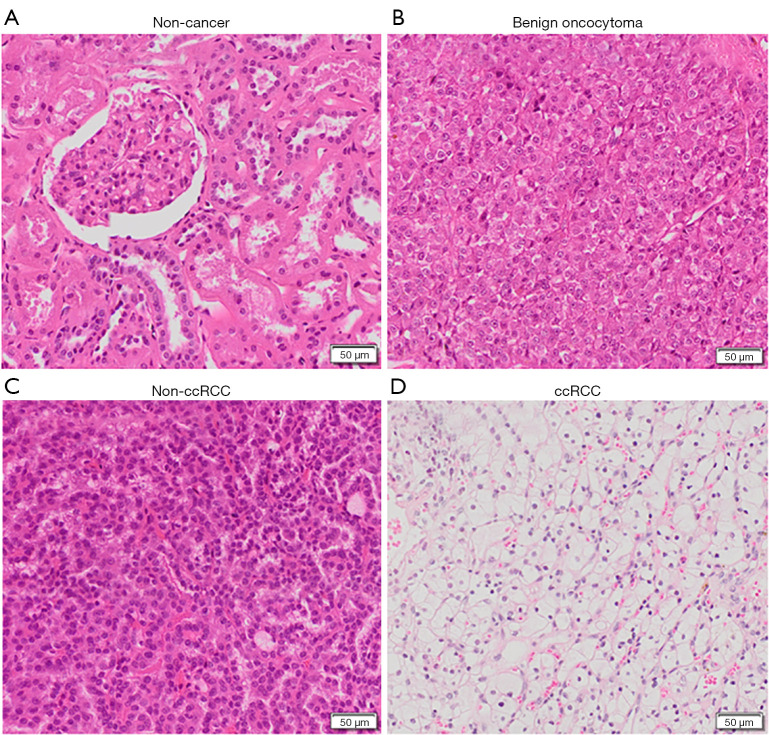
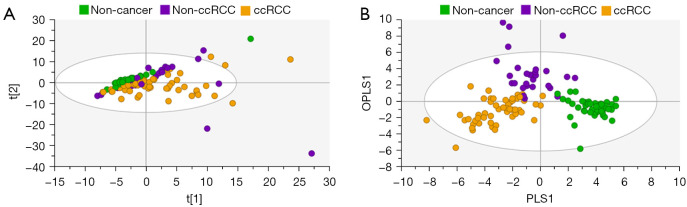
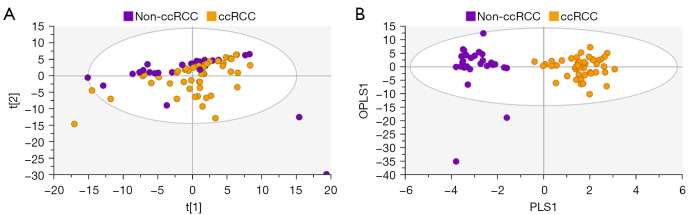
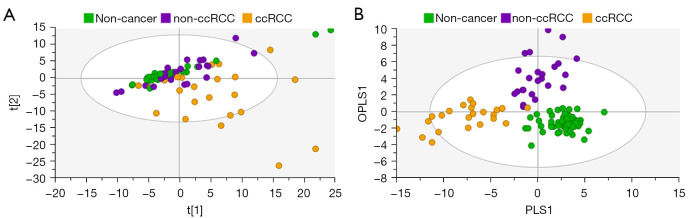
Methods: One hundred and twenty-six biopsy samples from patients with a confirmed enhancing kidney mass on abdominal imaging were analyzed as part of the training set. A further forty-three samples were used for model validation. In patients undergoing radical nephrectomy, biopsies of non-cancer kidney cortical tissue were also collected as a non-cancer control group. Spectroscopy data were analyzed using multivariate statistical analysis, including principal component analysis (PCA) and orthogonal projection to latent structures with discriminant analysis (OPLS-DA), to identify biomarkers in kidney cancer tissue that was also classified using the gold-standard of histopathology.

Results: The data analysis methodology showed good separation between clear cell renal cell carcinoma (ccRCC) versus non-clear cell RCC (non-ccRCC) and non-cancer cortical tissue from the kidneys of tumor-bearing patients. Variable Importance for the Projection (VIP) values, and OPLS-DA loadings plots were used to identify chemical species that correlated significantly with the histopathological classification. Model validation resulted in the correct classification of 37/43 biopsy samples, which included the correct classification of 15/17 ccRCC biopsies, achieving an overall predictive accuracy of 86%, Those chemical markers with a VIP value >1.2 were further analyzed using univariate statistical analysis. A subgroup analysis of 47 tumor tissues arising from T1 tumors revealed distinct separation between ccRCC and non-ccRCC tissues.

Conclusions: This study provides metabolic insights that could have future diagnostic and/or clinical value. The results of this work demonstrate a clear separation between clear cell and non-ccRCC and non-cancer kidney tissue from tumor-bearing patients. The clinical translation of these results will now require the development of a one-dimensional (1D) magnetic resonance spectroscopy (MRS) protocol, for the kidney, using an in vivo clinical MRI scanner.

Keywords: Renal cell carcinoma (RCC); magnetic resonance spectroscopy (MRS); multivariate statistical analysis; principal components analysis; spectroscopy-pathology correlation.


Conflict of interest statement

Conflicts of Interest: All authors have completed the ICMJE uniform disclosure form (available at https://tau.amegroups.com/article/view/10.21037/tau-21-1082/coif). SJDV received a University of Queensland Research Training Program Scholarship for her PhD studies and a Randal Silcock Bursary for conference travel. CEM has received research grants from Advance Queensland Research, was a consultant for the National Imaging Facility, and is a shareholder for DatChem Pty Ltd. and Goolwa Pty Ltd. The other authors have no conflicts of interest to declare.

Figures

Figure 1
Figure 1
Representative 1D spectra from non-cancer kidney, benign oncocytoma, non-ccRCC and ccRCC. 1D spectra have been recorded on a frequency axis to demonstrate the chemical shift in representative samples. Examples show (A) non-cancer renal cortex (non-cancer); (B) benign oncocytoma (non-ccRCC Oncocytoma), (C) papillary Type-1 RCC (non-ccRCC papillary Type 1); and (D) ccRCC. 1D, one-dimensional; RCC, renal cell carcinoma; ccRCC, clear cell renal cell carcinoma.
Figure 2
Figure 2
Representative 2D L-COSY spectra from non-cancer kidney, benign oncocytoma, non-ccRCC and ccRCC. Examples show (A) non-cancer renal cortex (non-cancer); (B) benign oncocytoma (non-ccRCC Oncocytoma), (C) papillary type-1 RCC (non-ccRCC Papillary Type 1); and (D) ccRCC. Labelled are the major lipid and cholesterol moieties which show a visible increase in these examples (within the spectra as A, B, C, D, CH3 and Chol), and selected resonances contributing to separation of the groups. Eth, ethanolamine; Gln, glutamine; Glx, glutamine/glutamate; Gltx, glutathione; Asn, asparagine; Gluc, glucose; Fuc, fucose; 2D L-COSY, two-dimensional COrrelated SpectroscopY; RCC, renal cell carcinoma; ccRCC, clear cell renal cell carcinoma.
Figure 3
Figure 3
Representative histopathology from non-cancer kidney, benign oncocytoma, non-ccRCC and ccRCC. Examples show labelled haematoxylin and eosin-stained sections from non-cancer kidney cortex (A, non-cancer); benign oncocytoma (B, benign oncocytoma); papillary type-1 renal cell carcinoma as non-ccRCC (C, non-ccRCC); and clear cell renal cell carcinoma (D, ccRCC). Scale bars =50 µm. RCC, renal cell carcinoma; ccRCC, clear cell renal cell carcinoma.
Figure 4
Figure 4
Principal component analysis of all tissue samples. (A) Clustering by PCA is demonstrated among ccRCCs (orange), non-cancer kidney tissue (green), overlapping with non-ccRCC tissues (purple). (B) OPLS-DA plots demonstrate clear separation of subtypes using supervised classification of tissues by group along their OPLS1 and PLS1 components. ccRCC, clear cell renal cell carcinoma; PCA, principal components analysis; OPLS-DA, orthogonal partial least squares discriminant analysis; OPLS1, orthogonal partial least squares; PLS1, partial least squares.
Figure 5
Figure 5
Exclusion of non-cancer control samples from subsequent principal component analysis. (A) Unsupervised clustering by PCA of ccRCC (orange) and non-ccRCC (purple) samples confirmed clustering of Figure 4A after removal of non-cancer tissues. (B) OPLS-DA plots demonstrate clear separation of subtypes using supervised classification of tissues by group along their OPLS1 and PLS1 components. ccRCC, clear cell renal cell carcinoma; PCA, principal components analysis; OPLS-DA, orthogonal partial least squares discriminant analysis; OPLS1, orthogonal partial least squares; PLS1, partial least squares.
Figure 6
Figure 6
Principal component analysis of T1 lesions from ccRCC and non-ccRCC compared with non-cancer tissue. (A) PCA shows clustering of T1 lesions from ccRCC (orange) and non-ccRCC (purple) samples. Green indicates the non-cancer tissue. (B) OPLS-DA plots demonstrate clear separation of the T1 lesion subtypes using supervised classification of tissues by group along their OPLS1 and PLS1 components. Green indicates clustering of the non-cancer tissue. ccRCC, clear cell renal cell carcinoma; PCA, principal components analysis; OPLS-DA, orthogonal partial least squares discriminant analysis; OPLS1, orthogonal partial least squares; PLS1, partial least squares.

Similar articles

Cited by

References

    1. Bray F, Ferlay J, Soerjomataram I, et al. Global cancer statistics 2018: GLOBOCAN estimates of incidence and mortality worldwide for 36 cancers in 185 countries. CA Cancer J Clin 2018;68:394-424. 10.3322/caac.21492 - DOI - PubMed
    1. Znaor A, Lortet-Tieulent J, Laversanne M, et al. International variations and trends in renal cell carcinoma incidence and mortality. Eur Urol 2015;67:519-30. 10.1016/j.eururo.2014.10.002 - DOI - PubMed
    1. Turner RM, 2nd, Morgan TM, Jacobs BL. Epidemiology of the Small Renal Mass and the Treatment Disconnect Phenomenon. Urol Clin North Am 2017;44:147-54. 10.1016/j.ucl.2016.12.001 - DOI - PMC - PubMed
    1. Giménez-Bachs JM, Salinas-Sánchez AS. Improving the diagnosis of renal masses: can we approach the histological diagnosis to the image? Ann Transl Med 2019;7:56. 10.21037/atm.2018.12.58 - DOI - PMC - PubMed
    1. Tomaszewski JJ, Uzzo RG, Smaldone MC. Heterogeneity and renal mass biopsy: a review of its role and reliability. Cancer Biol Med 2014;11:162-72. - PMC - PubMed